Excess Returns through a Structural Edge
Overview
In the pursuit of excess returns, many investors are constrained to security selection and tactical asset allocation. In this article, we explore how return stacking can be used to separate alpha from beta and pursue excess returns through a structural edge.
Key Topics
Capital Efficiency, Diversified Alternatives
For many investors, the pursuit of outperformance is limited to two approaches: security selection and tactical asset allocation. Both are notoriously difficult.
The S&P Dow Jones SPIVA® report finds that 86.6% of large-cap funds have underperformed the S&P 500 over the last five years.
According to Morningstar, even after adjusting for fees and volatility, funds in their Tactical Asset Allocation category have underperformed their strategic rivals by 2 percentage points per year.
Return stacking, however, offers a third approach. By separating alpha from beta, we can seek to develop a structural edge by stacking additional, alternative return streams on top of our existing portfolio.
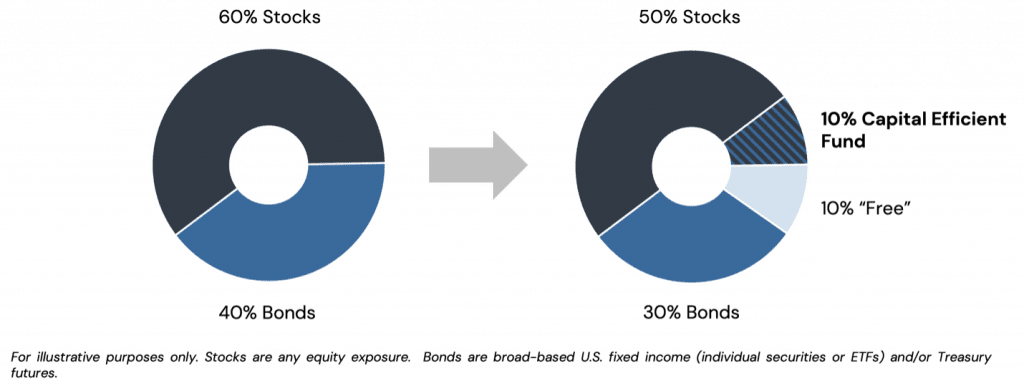
Consider the case of a 60% stock / 40% bond investor. By using a fund that provides capital efficient exposure to stocks and bonds, the investor can free up capital in their portfolio to invest elsewhere.
For example, in Figure 1, we assume there is a capital efficient fund that provides $1 of stocks and $1 of bonds for every $1 invested. By selling 10% of their stocks and 10% of their bonds and putting 10% into this fund, an investor is able to retain their 60/40 beta while freeing up 10% of the capital in their portfolio.
Figure 1: Example of How a Capital Efficient Fund Can Be Used to Free Up Capital in a Portfolio
How this freed up 10% is allocated is very much a choose your own adventure model. (If you choose to allocate it at all!)
One option is a diversifying alternatives fund. Or, a diversified set of diversified alternative funds.
Register for our Advisor Center
Tools Center:
Easily backtest & explore different return stacking concepts
Model Portfolios:
Return stacked allocations, commentary and guidance designed
for a range of client risk profiles and goals
Future Thinking:
Receive up-to-date insights into the world of return stacking theory and practice
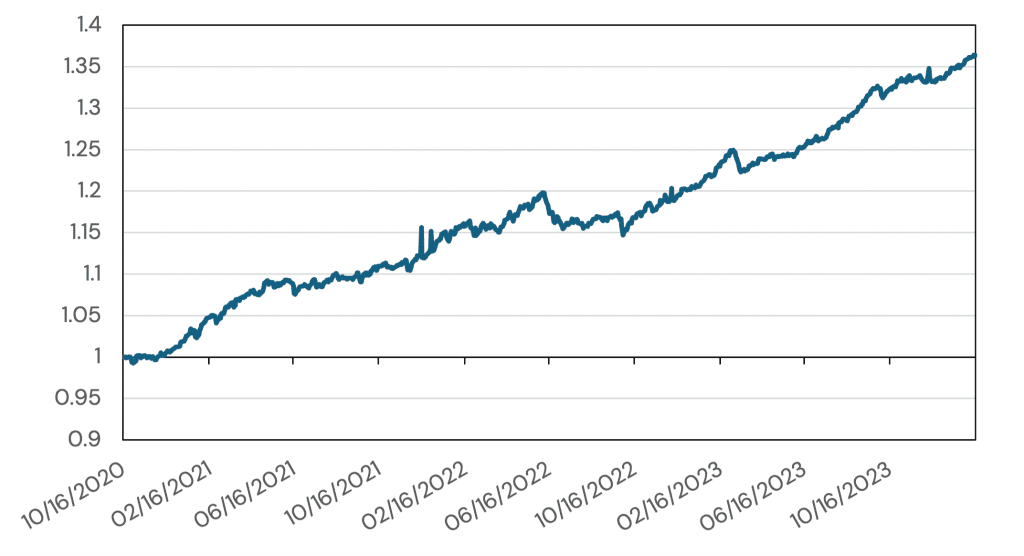
For example, an equal allocation to AQR’s Diversifying Strategies Fund (QDSIX), Stone Ridge’s Diversified Alternatives Fund (SRDAX), and FS’s Multi-Strategy Alternatives Fund (FSMSX) provides exposure to betas (stocks, bonds, and commodities), managed futures (systematic macro and managed futures), diversified arbitrage (merger, convertible bond, and event-driven), multi-asset style premia, long/short equity, multi-asset short volatility, reinsurance, alternative lending, asset-backed securities, real estate, and cryptocurrencies.
Since their joint inception on 10/16/2020, an equal weight portfolio of the three funds, rebalanced annually, has returned 10.1% annualized with a volatility of just 3.63%.
Figure 2: Growth of $1 in an Equal Weight Portfolio of QDSIX, SRDAX, and FSMSX
Source: Tiingo. Calculations by Newfound Research. Performance is backtested and hypothetical. Performance assumes the reinvestment of all distributions. Performance is gross of all fees, transaction costs, and taxes, with the exception of underlying fund expense ratios. Past performance is not a guarantee of future results.
Of course, the capital efficiency required to create a “60/40/10” portfolio comes at a cost. Fortunately, that cost has been, historically, close to the 3-month Treasury Bill rate. Taking this cost into account, the return of the blended alternatives portfolio would be reduced from 10.1% to around 8%.
Which means that a 10% allocation would have added approximately 0.8% to portfolio returns per year with just 0.36% tracking error. For a 60/40 investor, to achieve the same from security selection in stocks would require active managers to generate 1.33% in excess returns per year with a Sharpe ratio of 2! (1.33% = 0.8% / 60%; 2 = 1.33% / 3.63%).
This choice of funds is, by no means, meant to be prescriptive (please do your own due diligence). Rather, we only wanted to highlight the numerous potential benefits of stacking in this manner:
- By separating alpha from beta, we free ourselves to allocate into sources of alpha we have higher conviction in.
- We can separate the costs for alpha and beta more explicitly. In our example above, the equal-weight portfolio has an adjusted expense ratio of 1.74%. At just 10% of the portfolio, however, these funds would contribute just 0.174% to an investors overall annual expense. 50% in a low-cost global equity fund and 30% in a passive US bond fund would add another 0.025% and 0.012% respectively. Even if the capital efficient stock/bond fund cost 0.5%, the all-in cost of the portfolio would be just 0.259%. (Recall, though, that the returns above are already calculated net of acquired fund fees.)
- We can choose an overlay size that explicitly fits our tracking error budget.
There are also a few potential behavioral benefits to this approach, specifically with respect to reducing so-called “line-item risk” (the risk that a single position in a portfolio sticks out to a client in a negative way):
- Allocating to several diversifiers reduces the size of any single position.
- By allocating to multi-strategy funds, we can hopefully take advantage of their internal diversification and realize smoother equity curves.
By allowing investors to separate alpha from beta, we believe that return stacking can help investors pursue novel means to generating excess returns in their portfolios.


