Managed Futures Trend Following
Overview
Dive into the world of managed futures and learn about the strategies of return stacking in portfolio construction.
Key Topics
Managed Futures, CTAs, Trend Following
Table of Contents
History of CTAs, Managed Futures, and Trend Following
Theoretical Foundations of Managed Futures Trend Following
Managed Futures Trend Following Benchmarks and Replication
Potential Applications to Return Stacking Managed Futures Trend Following
Appendix
What is Managed Futures Trend Following?
Managed Futures, or Trend Following, refers to investment strategies that primarily rely on futures contracts as part of a portfolio management process, implemented by professional investment managers known as Commodity Trading Advisors (CTAs). Trend following is a subset of the managed futures category that seeks to benefit from the continuation of market trends: buying (going long) an asset when it has been doing well or selling (going short) an asset when it has been doing poorly. The core premise of trend following is that market prices can often exhibit persistent movements over time, and profits can be made by correctly identifying and following these trends.
As the strategies are typically implemented through futures contracts, the fund will usually hold a large majority of its assets in cash-like positions (money market funds or short-term Treasury bills) with those assets used as initial margin to open a futures contract position (long or short). A generic portfolio may then look like a 100% allocation to cash and additional allocations to futures contracts, both positive (long) and negative (short).
The specific assets that a trend follower may track typically vary quite widely, though the broad categories are commodities, currencies, fixed income, and equities. In those categories there will be many individual contracts traded such as gold futures or wheat futures in commodities, Euro futures or Japanese Yen futures in currencies, 10-Year U.S. Treasury futures or Japanese Government Bond futures in fixed income, and S&P 500 futures or Nasdaq futures in equities.
Generally, however, a trend following manager will seek to trade a wide variety of contracts to diversify its holdings, tracking anywhere from tens of contracts to hundreds. To improve diversification, some managers have taken to incorporating synthetic and alternative markets. Synthetic markets are those created by trading a combination of other markets; for example, long U.S. equities and short international equities or long 10-year U.S. Treasuries and short 2-year U.S. Treasuries. Alternative markets have no strict definition but are typically less liquid markets that often trade on less prominent exchanges or over-the-counter. Examples include French power markets, Chinese apples, or Turkish cross-currency swaps.
Trend following is almost entirely systematic in nature, relying on technical indicators to assess the trends in the underlying assets. Historically, trend-following managers have typically employed price-based indicators such as total return, price-minus moving average, breakout signals, and channel-based signals. Recently, some managers have also begun to follow trends on economic or fundamental factors. As strategies have evolved, and competition between managers has increased, managers have also integrated newer techniques such as machine learning to inform the trend following programs.
Along with differences in the markets they trade and the signals that they follow, trend followers may also trade at different speeds. Some trend followers may opt to trade at faster speeds (some as fast as intraday) to quickly react to changing market conditions, while others may trade much more slowly, looking to profit from long-running trends.
The dispersion in available signals, speeds, and markets traded means that there can be a wide degree of variation between any two managers, despite the high-level strategy concept being similar.
History of CTAs, Managed Futures, and Trend Following
One of the most famous sayings in investing is “Cut short your losses; let your profits run” attributed to David Ricardo in 1838 in vague reference to paying attention to trends.
More prominent investors implementing trend and momentum techniques were:
- Charles Dow (1851 – 1902): The founder and first editor of the Wall Street Journal, as well as the co-founder of Dow Jones and Company, published a market trend analysis in his Wall Street Journal column. Dow’s analysis eventually developed into a body of research, known as Dow Theory, which primarily focuses on trend identification as a primary signal for investing.
- Jesse Livermore (1877 – 1940): A prominent market speculator, Livermore famously made (and lost) two massive fortunes during the 1907 and 1929 stock market crashes. In Reminiscences of a Stock Operator, by Edwin Lefevre, Livermore is attributed to have stated “[T]he big money was not in the individual fluctuations but in the main movements … sizing up the entire market and its trend.”
The first managed futures fund was founded by Richard Donchian in 1949. Richard is widely regarded as the founder of the managed futures industry, and his rules-based investment processes form the foundation of modern trend following.
In the 1970s and 1980s, futures exchanges began increasing the set of tradable contracts and the number of trend following managed futures funds, as well as the assets invested in them, began to increase.
In 1983 and 1984, legendary commodities traders Richard Dennis and William Eckhardt sought to test whether trading skills could be systematically taught, rather than requiring an innate talent. The two traders selected a small group of untrained students from diverse backgrounds, known as the “turtles”, and over two weeks, imparted their trend-following trading system to the group, teaching a strict set of rules for entering and exiting trades. Dennis and Eckhardt then provided the newly trained traders with $1 million to trade after the class was completed (Covel, 2007; The Complete Turtle Trader). The results were astounding, with several of the Turtles collectively earning over $100 million over four years.
From the 1980s to the early 2000s, these strategies were relegated to hedge funds, with the only way to access these funds being public and private commodity pools as well as other hedge fund vehicles.
Figure 1: CTA Industry AUM over Time (Billions USD)

Source: BarclayHedge
Just a month after the popular Fama French factor model was published in 1993, Narasimhan Jegadeesh and Sheridan Titman published “Returns to Buying Winners and Selling Losers: implications for Stock Market Efficiency” in which the authors demonstrated that “[s]trategies which have performed well in the past and sell stocks that have performed poorly in the past generate significant positive returns over 3- to 12-month holding periods.” Although many discovered factors have failed to hold up under scrutiny, trend following (momentum) remained a robust factor in the explanation of returns. From this seminal paper, the “quantitative trend” category was born.
As quantitative trend strategies began to take hold (alongside the proliferation of other systematic-based investing strategies), the ability to test and explain such strategies resulted in an abundance of academic literature exploring the topic. With quantitative strategies beginning to emerge, so did the managed futures concept of constant volatility-targeting.
In trend following as it had been known, the typical portfolio construction practice was to deploy a constant initial dollar value (or percentage of a portfolio) to any new position.
The quantitative traders took this further, realizing that instead of allocating based on dollar values, the portfolio could be constructed such that no position held a higher risk allocation than another. The next step then could be to scale the underlying portfolio allocations, either downwards or upwards, to target a desired volatility level. This additional step yields a portfolio that is equal risk weighted across the underlying positions, limiting the portfolio risk from any one asset.
Traditional trend followers argue that this approach diminishes the returns in outlier trends, as stronger trends often coincide with higher volatility, which leads quantitative traders to cut the position size. For more information on the volatility targeting approach, please see Time Series Momentum (Moskowitz et al., 2011).
In February of 2007, Rydex launched the first managed futures mutual fund, the Rydex | SDI Managed Futures Strategy. Several others launched in the aftermath of the financial crisis. The availability of public funds continued with a 2011 report from Morningstar stating that as of September 2011, there were over 300 systematic futures hedge funds with a total of $83.7 billion in assets and 19 managed futures mutual funds with $7.8 billion in assets.
Figure 2: Managed Futures Funds and Assets Across Vehicle

As can be seen in the figure above, the ETF category was fairly meager, with only two offerings at the time.
Theoretical Foundations of Managed Futures Trend Following
With trend following’s rich history in financial markets and centuries of evidence supporting its efficacy, a valid question to ask is: why do markets trend?
With the continued interest in trend following and momentum-linked strategies, an abundance of academic papers, explanations, and theories were put-forth. One of the most representative surveys on the topic came from Hurst, et al. (2013) who described the possible explanations for why trends exist and persist in the market.
Figure 3: Stylized Plot of the Lifecycle of a Trend

We describe a few of the most popular and established reasons in the section below.
- Anchoring Bias: Anchoring bias is the behavioral bias that causes investors to rely too heavily on previous information, leading to resisting the incorporation of new information. As a result, events such as surprises in equity earnings, macroeconomic announcements, or other lucrative information may be initially ignored by the market, leading to a gradual trend towards the new state.
- Confirmation Bias: Investors hate to be wrong. In light of this, an investor may tend to ignore information that contradicts their beliefs, or if an investment is doing well, may add to the position, extending the trend (Kahneman and Tversky, 1979)
- Herding and Feedback: The herding effect describes the phenomenon that investors tend to pile into investments that have been doing well for others (Bikhchandani, et al., 1992), or positive feedback trading (Economou et al., 2022, Long et al., 1990).This phenomenon is also seen outside of the investing landscape. In a 2006 social study, three social researchers sought to identify the independence of preference and success in music by allowing various sub-groups to explore a music library, where some of the groups were shown metrics such as number of downloads and ratings, while other groups would not be able to see these metrics (Salganik et al., 2006). The results of this study showed that successful songs were directly influenced by social forces, as opposed the hypothesis that “good music” should hold the same degree of success regardless of perceived social acceptance. Given that such a phenomenon may be an inherent feature of human behavior, it would make sense that such an effect would be seen in all facets of society in which humans employ decision making.
- Disposition Effect: The disposition effect alludes to the tendency of investors to sell winning trades too quickly, realizing gains, while holding onto losers too long, in the hopes of making the money back or not realizing losses on the trade. In the positive direction, investors taking gains too quickly puts downward pressure on the price of the asset, slowing the adjustment to the new, higher value. The investors that hold on to losses, on the other hand, inhibit the movement of prices downward efficiently (Shefrin and Statman, 1985, Frazzini, 2006).
- Rational Inattention Bias: When a new piece of information is released to the marketplace, it is feasible that investors may not get access to the information and process it accurately, immediately. Due to this delay in the reception and processing of information, investors may under- or over-invest due to new information coming to the market (Huang and Liu, 2007).
Managed Futures Trend Following Benchmarks and Replication
When assessing the performance of managers focused on more ubiquitous asset classes such as equities, it is quite easy to compare the return of the manager to that of the S&P 500, or other well-known indices. When accomplishing the same task with trend following, however, that task is not as straightforward. These indexes do exist, however, with many of them being a composite of trend following managers, or generic implementations of trend following strategies.
The most cited of these benchmarks may be the Société Générale CTA Index, the Société Générale Trend Index, and the BarclayHedge BTOP50 Index. These popular indices are comprised of managers in the CTA or trend following space that meet certain criteria to be included in the index and report the returns of their programs to the index provider daily.
Other available indices that use the manager composite approach include the Barclay CTA Index, the Eurekahedge CTA/Managed Futures Hedge Fund Index, and the Société Générale Short-Term Traders Index, though, these indices are not as common as the ones above.
In addition to the indices that report composite performance, there also exist indices that construct simple models to measure momentum in a variety of futures markets to create a gauge of trend following as a whole. Examples of such benchmarks include the Société Générale Trend Indicator or the S&P Diversified Trends Indicator. Additionally, the Morningstar managed futures platform utilizes the Credit Suisse Managed Futures Liquid Index as the primary index in the Systematic Trend fund category.
Benchmarks: Replication Methodologies
As noted above, given the wide variety of implementations of trend following, performance dispersion between any two trend following programs can be quite large. As an example, the managed futures category in 2022 posted strong performance amid the inflation volatility over the year. However, the difference between the highest and lowest performing managed futures funds (mutual funds and ETFs) was an astounding 65%, with the highest returning 58.09%, and the lowest returning -7.28%.
The following figure illustrates the range (highest and lowest) of calendar year returns for a cohort of managed futures funds that have been available since 2011. It displays the lowest and highest annual returns across the cohort alongside the performance of the BTOP50 index, which serves as a broad benchmark for managed futures strategies.
Figure 4: Managed Futures Fund Category Return Characteristics by Year

Source: BarclayHedge, Tiingo. Performance is backtested and hypothetical. Performance data begins in 2011 and ends in 2023 due to data availability. Performance assumes the reinvestment of all distributions. Past performance is not indicative of future results. See Appendix A for index definitions. Fund returns begin in 2011 due to data availability. Fund returns are calculated by analyzing a cohort of 23 mutual funds and ETFs with the funds being included when sufficient data is available.
Given this potential dispersion in results, an ideal solution could be to invest in all of the constituent managers in one of the indices to reduce the impact of manager luck. While indices such as the BTOP50 and the Société Générale Trend indices are technically investable, investing in all of the individual managers may be impractical. Additionally, the fees charged in trend following funds can be high, specifically for the private hedge fund implementations which often incorporate an incentive fee in addition the management fee.
In the past few years, a solution to this problem has emerged by replicating an underlying index through statistical or fundamental methods. Replication seeks to use models to position a portfolio in a similar way to the index using regression techniques to assess what the index may be holding if the holdings of the index are not known, or creating models that mimic how the index is designed or invests. In Peering Around Corners: How to Replicate Trend Following Managed Futures, the authors explore the process and implementation of replication when applied to the Société Générale CTA Trend Index, while highlighting the benefits and hurdles of each individual approach.
The first approach, which we have named “Top-Down replication” seeks to identify the portfolio weights that closely replicate the recent returns of the target index. To accomplish this, a top-down methodology might use statistical models such as linear regression to find a portfolio that best matches how the index has performed in the recent past.
The second approach, which we have named “Bottom-Up replication” takes a different approach to answering that same question. A bottom-up approach would assess the index’s investment methodology and seek to identify the investment strategies that closely replicate the returns of the target index. In the case of trend following, a bottom-up approach may create its own trend following strategies and assemble them in such a way that mimics the returns of a basket of trend following managers.
Additional Literature, Theoretical Evidence, and Implications for Portfolios
Building on the empirical success of trend following, and the initial publication of momentum’s success, the body of literature reviewing, and trying to explain, trend following took off in the 1990s, and has continued since.
- In Parallels between the Cross-Sectional Predictability of Stock and Country Returns by Asness et al. (1997), the authors found that momentum investing is a profitable investment strategy when applied to country indices.
- The Tactical and Strategic Value of Commodity Futures by Erb and Harvey (2006), finds that deploying momentum strategies in commodity markets produces a significant improvement of excess returns when compared to a buy-and-hold commodity strategy.
- In The Fundamentals of Commodity Futures Returns by Gorton et al. (2007), the authors find that commodity risk premiums vary over time and identify the benefit of momentum in both commodity futures, as well as spot prices.
- In Momentum in Corporate Bond Returns (Jostova et al., 2010) the authors explore momentum strategies in individual corporate bonds, finding that such a strategy would generate significant profits.
- Time Series Momentum (Moskowitz et al., 2011) examine 58 liquid futures contracts among equity, currency, commodity, and fixed income, finding significant momentum characteristics in each of the representative contracts.
- Momentum in Government Bond Markets (Luu and Yu, 2012) explored the topic of momentum in government bond markets, finding that simple trend-following rules generate positive risk-adjusted returns.
- In Two Centuries of Trend Following (Lempérière et al., 2014), the authors review the characteristics in trend following in across commodities, currencies, equity indices, and fixed income, concluding that trend is one of the “most statistically significant anomalies in the financial markets”.
- Taming of the Skew (Hoffman and Kaminski, 2016) reviews how the positive skewness of trend following can be applied, both as a diversifier and complement to an existing portfolio.
- A Century of Evidence on Trend-Following Investing (Hurst et al., 2017) studied the performance of trend following strategies across global markets, using over a century of compiled data. The authors found that trend following posted positive returns, additionally finding that the strategy performed well during crisis periods, as well as during periods in which a strategic 60/40 portfolio was in a drawdown.
- Using Trend-Following Managed Futures to Increase Expected Withdrawal Rates (Miller, 2017) reviews the incorporation of managed futures to a stock/bond portfolio can increase the capacity for withdrawals in retirement.
- In The Best Strategies for Inflationary Times (Neville et al., 2021) seek to dissect the strategies that provide the largest benefit in inflationary periods, as well as “normal” times, finding that trend following provides the most reliable protection.
Performance History
In this section, we show the historical performance of trend following using the BarclayHedge BTOP50 Index, in relation to global equities, US Bonds, and a balanced 60/40 portfolio.
Figure 5: Growth of $1 in Stocks, Bonds, Balanced 60/40, and Managed Futures Trend Following

Source: Bloomberg, BarclayHedge, FRED, Philadelphia Fed. Performance is backtested and hypothetical. Performance data begins in 1986 and ends in 2023 due to data availability. Performance is gross of all costs (including, but not limited to, advisor fees, manager fees, taxes, and transaction costs) unless explicitly stated otherwise. Performance assumes the reinvestment of all distributions. Past performance is not indicative of future results. See Appendix A for index definitions.
Figure 6: Performance Statistics of Stocks, Bonds, Balanced 60/40, and Managed Futures Trend Following

Source: Bloomberg, BarclayHedge, FRED, Philadelphia Fed. Performance is backtested and hypothetical. Performance data begins in 1986 and ends in 2023 due to data availability. Performance is gross of all costs (including, but not limited to, advisor feed, manager fees, taxes, and transaction costs) unless explicitly stated otherwise. Performance assumes the reinvestment of all distributions. Past performance is not indicative of future results. See Appendix A for index definitions.
Figure 7: Performance During Equity Drawdowns (Greater than 20%)

Source: Bloomberg, BarclayHedge, FRED, Philadelphia Fed. Performance is backtested and hypothetical. Performance data begins in 1986 and ends in 2023 due to data availability. Performance is gross of all costs (including, but not limited to, advisor feed, manager fees, taxes, and transaction costs) unless explicitly stated otherwise. Performance assumes the reinvestment of all distributions. Past performance is not indicative of future results. See Appendix A for index definitions.
Figure 8: Performance During Fixed Income Drawdowns (Greater than 5%)

Source: Bloomberg, BarclayHedge, FRED, Philadelphia Fed. Performance is backtested and hypothetical. Performance data begins in 1986 and ends in 2023 due to data availability. Performance is gross of all costs (including, but not limited to, advisor feed, manager fees, taxes, and transaction costs) unless explicitly stated otherwise. Performance assumes the reinvestment of all distributions. Past performance is not indicative of future results. See Appendix A for index definitions.
Figure 9: Rolling 12-Month Correlation of Managed Futures Trend Following to Stocks and Bonds
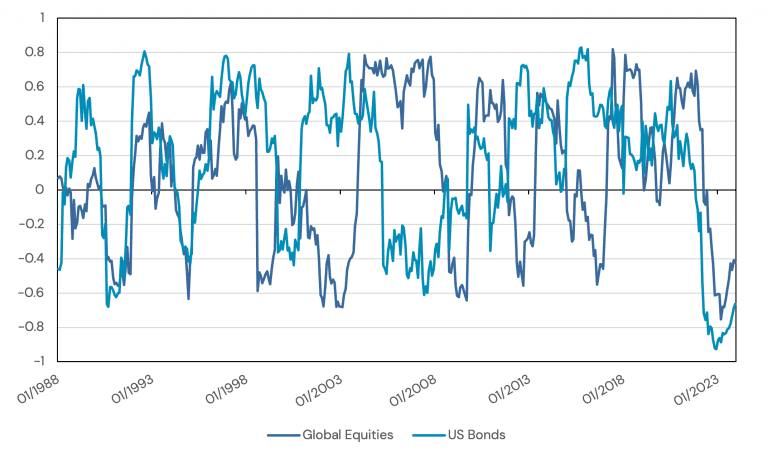
Source: Bloomberg, BarclayHedge, FRED, Philadelphia Fed. Performance is backtested and hypothetical. Performance data begins in 1986 and ends in 2023 due to data availability. Performance is gross of all costs (including, but not limited to, advisor feed, manager fees, taxes, and transaction costs) unless explicitly stated otherwise. Performance assumes the reinvestment of all distributions. Past performance is not indicative of future results. See Appendix A for index definitions.
Figure 10: Sharpe Ratio of Stocks, Bonds, and Managed Futures Trend Following in Different Economic Regimes

Source: Bloomberg, BarclayHedge, FRED, Philadelphia Fed. Performance is backtested and hypothetical. Performance data begins in 1986 and ends in 2023 due to data availability. Performance is gross of all costs (including, but not limited to, advisor feed, manager fees, taxes, and transaction costs) unless explicitly stated otherwise. Performance assumes the reinvestment of all distributions. Past performance is not indicative of future results. See Appendix A for index definitions.
Potential Applications to Return Stacking Managed Futures Trend Following
There is an impressive corpus of historical evidence supporting the viability of trend following as a stand-alone investment strategy. The strategy’s empirical record of holding low correlations to both equity and fixed income markets supports its place as a potentially diversifying asset to traditional investment portfolios. On top of those foundational aspects, why might an investor choose to include trend following in a portfolio?
Below we show some examples of how one might contemplate use cases for managed futures in an investment portfolio.
If you’d like to explore any of these scenarios, please visit the Return Stacked Tools site to find tools to test and visualize these ideas in an intuitive framework.
Return Stacking Managed Futures Trend Following for Growth
Investors with a long investment horizon can bear more risk in the hopes of achieving a higher growth rate. Traditionally, an investor in this scenario would hold a high allocation to stocks with little, if any, fixed income allocation.
Managed futures offer an additional opportunity for growth-oriented investors. By stacking trend following strategies on top of core assets like equities and bonds, portfolios can potentially maintain their existing exposure to equities while accessing an additional return stream. Furthermore, the empirically low correlation between equities and trend following may provide increased diversification benefits to the overall portfolio.
Return Stacking Managed Futures Trend Following for Diversification
One of the most common investment portfolios is the 60/40 stock and bond portfolio. Investors have become accustomed to bonds being a reliable complement to equities, specifically in equity drawdowns. However, the low correlations between stocks and bonds that many investors depend on may not be supported by a broader historical perspective. Rather, they are largely an artifact of the sustained economic disinflationary trend since the 1980s, which may not persist in coming decades.
Commensurately, there are two reasons to consider adding a third leg to the stock/bond stool. The first consideration would be the potential improvement of a portfolio from adding an additional uncorrelated asset. The second would be the new asset’s sensitivity to economic regimes.
Trend following can potentially satisfy both considerations.
The low correlation that trend following has exhibited with both stocks and bonds, as well as its historical positive returns, suggests that stacking the strategy on top of an existing stock-bond portfolio may improve the long-term expected return, volatility, and Sharpe ratio of the portfolio.
In a 2023 Barclay’s article, the authors reviewed the sensitivity of different investments to inflation and growth oriented macroeconomic regimes. Trend following exhibited positive returns in low growth regimes, diversifying the equity risk of a portfolio, and in high inflation regimes, diversifying the interest rate exposure of a portfolio.
Figure 11: Managed Futures Trend Following Performance in Different Economic Regimes

Return Stacking Managed Futures Trend Following as a Fiat Hedge
When investors are concerned with inflation or currency devaluation, they often seek to hedge by purchasing broad commodities, gold and/or real assets.
While these assets have historically been effective in inflationary periods, there are a few reasons that trend following may be better suited to protect against this risk.
The first stems from a behavioral aspect of investing. Historically, broad commodities effectively hedged against inflation but may have been challenging to maintain in portfolios during disinflationary growth periods due to prolonged flat or negative returns between inflationary episodes. As described in The Best Strategies for Inflationary Times (Neville et al., 2021), trend following also realized positive returns in inflationary periods, but importantly, also realized positive returns in the other periods. By showing positive returns on average, holding the strategy in an investment portfolio would have been an easier exercise, so that the portfolio had inflation protection when it was needed.
Trend following may also be a more reliable inflation hedge because not all inflation is the same. Different inflation drivers, such as demand versus supply, and market and policy responses, can lead to varying impacts on real assets like commodities. Moreover, high inflation in the services sector may not affect commodities prices.
By trading across many asset classes, including commodities and currencies, trend followers have the opportunity to assess the investment landscape for specific sectors that may be being influenced by inflation, and trading into these markets as trends emerge.
Appendix A: Index Definitions
Global Equities – The MSCI ACWI Total Return Index (Bloomberg ticker: MXWD Index). Performance is gross of all costs (including, but not limited to, advisor feed, manager fees, taxes, and transaction costs). Source: Bloomberg.
US Bonds – The Bloomberg US Aggregate Total Return Value Unhedged USD Index (Bloomberg ticker: LBUSTRUU Index). Performance is gross of all costs (including, but not limited to, advisor feed, manager fees, taxes, and transaction costs). Source Bloomberg.
Managed Futures (Net) – The BarclayHedge BTOP50 Index. The BTOP50 Index seeks to replicate the overall composition of the managed futures industry with regard to trading style and overall market exposure. The BTOP50 employs a top-down approach in selecting its constituents. The largest investable trading advisor programs, as measured by assets under management, are selected for inclusion in the BTOP50. In each calendar year the selected trading advisors represent, in aggregate, no less than 50% of the investable assets of the Barclay CTA Universe.
Balanced 60/40 – A monthly rebalanced portfolio consisting of a 60% allocation the MSCI ACWI Total Return Index and a 40% allocation to the Bloomberg US Aggregate Total Return Value Unhedged USD Index. Performance is gross of all costs (including, but not limited to, advisor feed, manager fees, taxes, and transaction costs). Source Bloomberg.
Appendix B: Regime Definitions
Based upon the work in Exploring Macroeconomic Sensitivities: How Investments Respond to Different Economic Environments by Ilmanen, Maloney, and Ross.
Growth and Inflation are each defined as a composite of two series, which are first normalized to z-scores by subtracting the historical mean and dividing by the historical volatility.
“Up” and “Down” regimes are defined as those times when measures are above or below their full sample median.
Growth:
- Chicago Fed National Activity Index
- Realized Industrial Production minus prior year Industrial Production forecast from the Survey of Professional Forecasters.
Inflation:
- Year-over-year CPI change
- Realized year-over-year CPI minus prior year NGDP forecast from the Survey of Professional Forecasters.