Bonds Plus Alternatives and Chill?
Overview
With nominal yields for 10-year U.S. Treasuries hovering around 5%, we explore whether a return stacked “bonds plus” strategy utilizing portable alpha techniques, can serve as an alternative to core equity holdings for intermediate investment horizons.
Key Topics
Return Stacked Bonds, Bonds Plus, Managed Futures, Equity Replacement, Portable Alpha
Are Current Yields Attractive Enough?
In the aftermath of the Great Financial Crisis, the financial landscape saw a significant shift due to quantitative easing, causing fixed income yields to plunge. Investors, seeking higher returns, ventured into riskier markets, exemplifying the ‘reaching for yield’ phenomenon. Recently, a surge in nominal yields has led to a critical question: Is the additional risk justified when a nearly guaranteed 5% return is within reach?
Examining the correlation between current yields and long-term expected returns becomes crucial in this scenario.
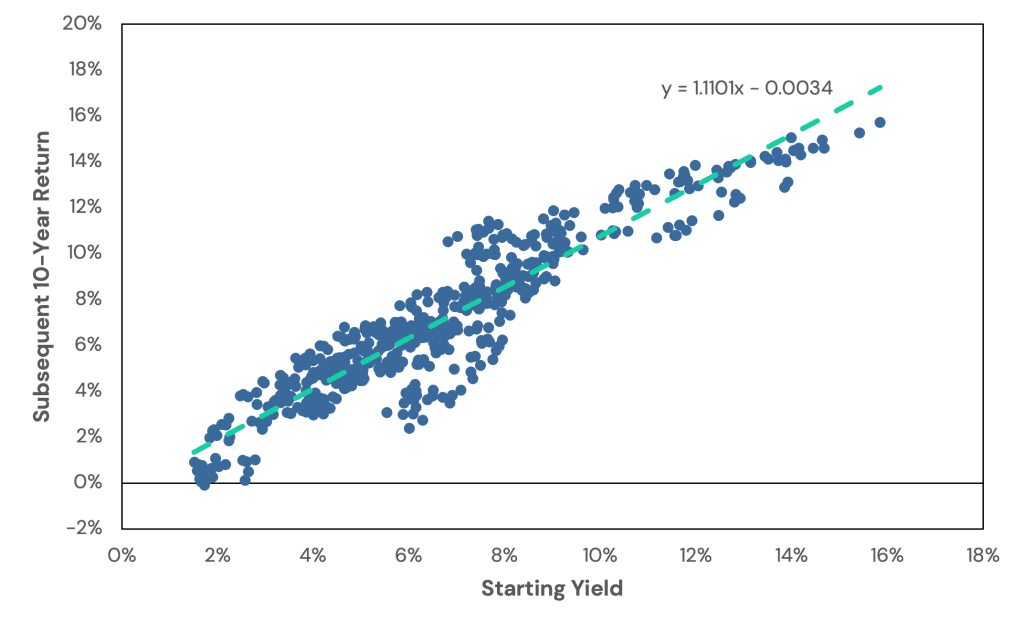
By comparing the initial 10-year U.S. Treasury bond yields with the forward 10-year annualized returns of a constant-maturity 10-year U.S. Treasury index, a surprising revelation unfolds: there exists a remarkable degree of predictive power.
Figure 1: Relationship Between Starting Yield and Forward 10-Year Returns for 10-Year Treasury Bonds
Source: Federal Reserve Bank of St. Louis. Calculations by Newfound Research. 1963 is the first year for the information presented because 1953 is the first date with monthly 10-year constant maturity interest rate data. The 10-Year U.S. Treasuries Index is a constant maturity index calculated by assuming a 10-year bond is purchased at the beginning of every month and sold at the end of that month to purchase a new bond at par at the beginning of the next month.
At the time of writing, the 10-year U.S. Treasury yield is currently around 5%, meaning we can fairly confidently expect our 10-year return to be around 5% annualized.
This insight holds immense significance for investors navigating today’s complex financial landscape. Understanding the relationship between current yields and future returns can guide strategic investment decisions, especially given the recent uptick in nominal yields.
In essence, the interplay between historical yields and forthcoming returns provides a valuable lens through which investors can assess risk and make informed choices, shaping the trajectory of their portfolios in an uncertain market.
Register for our Advisor Center
Tools Center:
Easily backtest & explore different return stacking concepts
Model Portfolios:
Return stacked allocations, commentary and guidance designed
for a range of client risk profiles and goals
Future Thinking:
Receive up-to-date insights into the world of return stacking theory and practice
Return Stacked Bonds: Applying Portable Alpha to Fixed Income
While a stable 5% expected return may sound appealing, since 1999, broad U.S. equities have returned an annualized 7%. Investors with longer horizons seeking higher growth potential may prefer the upside potential of equities over settling for a potentially lower return in fixed income. But what if we didn’t have to settle for “just” 5% in fixed income?
By utilizing capital-efficient techniques, we can incorporate additional sources of return without reducing the 5% expected return of our fixed income portfolio. This approach is akin to portable alpha, where uncorrelated strategies are overlaid onto a core portfolio to enhance returns without increasing market exposure. For example, we could overlay a capital-efficient, historically uncorrelated strategy such as managed futures.
If we examine the performance of various managed futures indices, specifically the SocGen CTA Trend Index, the BarclayHedge BTOP50 Index, and the Credit Suisse Liquid Alternative Beta Managed Futures Index, we find that the annualized excess return for these indices is 4.2%, 4.2%, and 2.5%, respectively. Further, the average rolling ten-year return for these three indices was 3.1%.
Using 3.1% as our estimate for expected 10-year excess returns, overlaying managed futures on top of fixed income can increase our expected linear return from 5.5% to 8.6% (and our compound return from 5.4% to 7.5%).
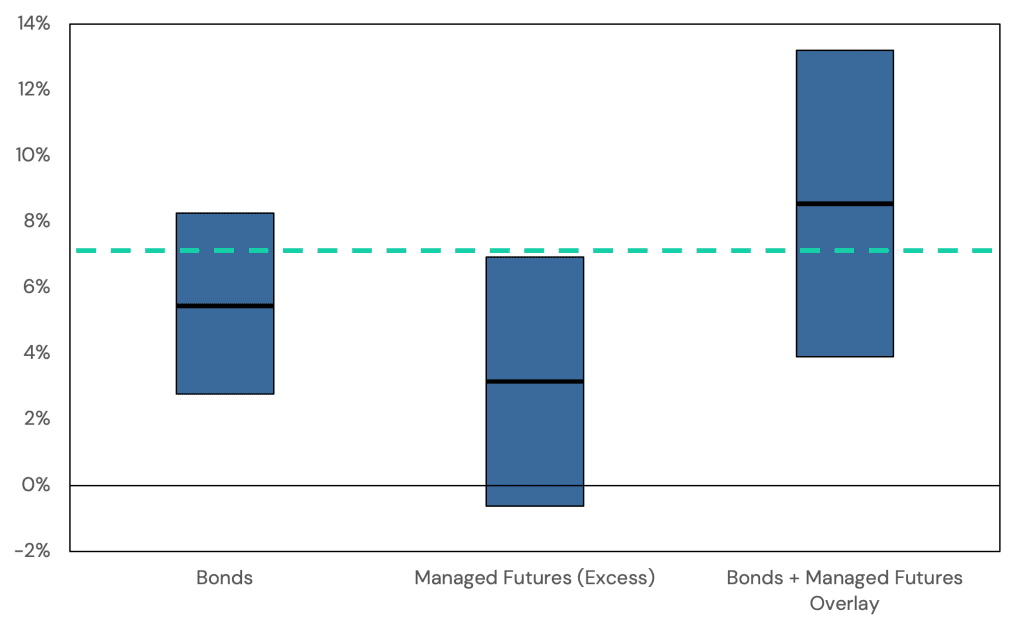
In Figure 3, we show the expected return and 95% confidence intervals of three portfolios: bonds, managed futures, and a bond portfolio with a 100% overlay to managed futures. In green, we also show the realized returns of U.S. equities from 1999 to 2023.
Figure 3: Expected Return and Confidence Intervals of U.S. Bonds, Managed Futures, and a U.S. Bonds plus Managed Futures Portfolio
Source: Bloomberg and the Kenneth French Data Library. Calculations by Newfound Research. Bonds is the expected return and confidence interval of the Bloomberg US Agg Total Return Value Unhedged USD index (Bloomberg ticker: LBUSTRUU). Managed Futures is an estimate of the expected return and confidence interval of the managed futures category using the average ten-year annualized excess return of the SocGen CTA Trend Index, the BarclayHedge BTOP50 Index, and the Credit Suisse Liquid Alternative Beta Managed Futures Index. Past performance is no guarantee of future returns. You cannot invest directly in an index. Diversification does not guarantee a profit.
Conclusion
In times of economic uncertainty, holding or increasing equity allocations may be a dubious proposition. Growth investors, however, may often feel they have no other choice.
Given the current fixed income environment, there is a case to be made that the expected returns of fixed income may be suitable for many investors over an intermediate (e.g., 10-year) horizon.
By employing return stacking techniques through portable alpha strategies, investors may be able to enhance expected returns, creating the potential for equity-like growth without taking equity risk.
As investors continue to survey this rapidly evolving investment landscape, we believe this “bonds plus” approach may be particularly suitable for:
- Growth-oriented investors looking to reduce outcome uncertainty;
- Conservative investors seeking alternatives to equity in intermediate-term liquidity buckets;
- Investors who hold bearish views on equities but don’t want to sacrifice long-term growth potential;
- Liability-driven investors looking to immunize future liabilities without necessarily sacrificing growth.
The Return Stacking landscape is ever evolving, go deeper by connecting with a team member.
Appendix: Index Definitions
BarclayHedge BTOP50 Index: The BTOP50 Index seeks to replicate the overall composition of the managed futures industry with regard to trading style and overall market exposure. The BTOP50 employs a top-down approach in selecting its constituents. The largest investable trading advisor programs, as measured by assets under management, are selected for inclusion in the BTOP50. In each calendar year, the selected trading advisors represent, in aggregate, no less than 50% of the investable assets of the Barclay CTA Universe. Excess returns are measured against 1-3 month U.S. Treasury Bills.
Bonds: The Bloomberg US Agg Total Return Value Unhedged USD index (Bloomberg ticker: LBUSTRUU).
Credit Suisse Liquid Alternative Beta Managed Futures Index (CSLABMF): The Credit Suisse Managed Futures Liquid Index seeks to gain broad exposure to the Managed Futures strategy using a pre-defined quantitative methodology to invest in a range of asset classes including equities, fixed income, commodities, and currencies (Bloomberg ticker: CSLABMF). The CSLABMF index is reported gross of fees. In this article, we report net-of-fee returns. Our fee assumptions consisted of the following: prior to 2013, returns assume a 2-and-20 fee structure; after 2013, fees are net of an annualized 1.50% fee. Excess returns are measured against 1-3 month U.S. Treasury Bills.
SocGen CTA Trend Index: The SG CTA Trend Index (Bloomberg ticker: NEIXCTAT) is equal-weighted and reconstituted annually. The index calculates the net daily rate of return for a pool of trend following based hedge fund managers. Excess returns are measured against 1-3 month U.S. Treasury Bills.
U.S. Equities: U.S. total equity market return data from Kenneth French Library. Performance is gross of all costs (including, but not limited to, advisor fees, manager fees, taxes, and transaction costs) unless explicitly stated otherwise. Performance assumes the reinvestment of all dividends.


