Cash Drag, Liquidity Needs, and Return Stacking
Overview
Cash can be an important tool for asset managers, advisors, and individuals alike. Holding too much cash on hand for too long, however, can lead to cash drag. In this article we explore how capital efficient solutions can help make cash available to be drawn when needed without necessarily creating cash drag when the cash is not being used.
Key Topics
Cash Drag, Cash Management, Liquidity Management, Capital Efficiency
Introduction
As asset managers, we tend to spend a lot of our time and energy improving what goes into an investment portfolio. What this effort may miss, however, is the entire wealth picture of a client.
In many cases, investors will hold ample cash reserves, kept entirely separate from his or her investment portfolio, for a variety of short-term liquidity purposes. For retirees, this cash reserve can provide comfort that, at least for the near future, short-term lifestyle needs can be met. Advisors will often keep cash in client portfolios to help manage cash-flow needs (including the advisor’s fee). Institutions and high net worth individuals will often keep cash around to meet the capital calls of private funds they’ve invested in.
In other words, cash is a powerful tool. Keeping too much wealth in cash, however, may create a return drag on long-term wealth accumulation.
Return stacking can provide a potential solution in these cases, as an investor can right-size an investment portfolio to ensure that our total asset base is working for us.
Case Study: Cash Reserves in Retirement
For many of us, retirement is a huge milestone. Being able to spend our time doing what we want to do as opposed to what we must do is a very compelling idea.
What we often don’t think about is the psychological aspect of retirement. From a wealth management perspective, one primary point of emphasis is how to ensure that we have enough cash on hand so that a retiree can live comfortably in the short term, regardless of what their investment portfolio is doing at any given moment. A common approach to safeguard spending is to keep a certain amount of total wealth in cash, ranging anywhere from a three-month buffer to a few years.
From a comfort perspective, this strategy makes a lot of sense. The retiree can see precisely how much cash is in a savings account and know whether their current level of spending will deplete that balance or be maintainable. It also allows for unexpected expenses such as sudden travel plans, unforeseen home repairs, or emergency medical bills.
What that leaves us with, though, is a choice on how we allocate our wealth. Do we decrease our investment portfolio each year to ensure that we have an ample cash buffer, or do we keep our cash balances low so our investments can sustain our retirement longer?
We advocate for saying “and” not “or”. Return stacking eliminates the need to make this choice. An investor can maintain sufficient cash reserves and keep a full wealth allocation in their investment portfolio.
Register for our Advisor Center
Tools Center:
Easily backtest & explore different return stacking concepts
Model Portfolios:
Return stacked allocations, commentary and guidance designed
for a range of client risk profiles and goals
Future Thinking:
Receive up-to-date insights into the world of return stacking theory and practice
How Does Return Stacking Change the Conversation?
Before we get too deep into the rabbit hole, we will first present a bit of math (don’t worry, it’s pretty simple).
Ignoring rebalancing decisions, we can broadly model the expected return of our wealth through the following equation, where E[Rw] is our expected total wealth return, c is our allocation to cash, E[Rc] is the expected return of cash, and E[Rp] is the expected return of our investment portfolio.
E[Rw] = c x E[Rc] + (1 – c) x E[Rp]
In this framework, the intuition is relatively straightforward. For every percent that we decrease our allocation to our investment portfolio, we shift the return of our total wealth from the return on our investments to that of cash.
What if instead of having cash sit around, you could remain fully invested, but had a line of credit available to you at one of the lowest interest rates available anywhere? And instead of having to pay explicit interest on that line of credit when you used it, the interest was merely deducted from your investment returns?
That is precisely what return stacking can enable.
One way to think about return stacking is borrowing cash to add more investment exposure on top of our existing portfolio. With this framework, we can add the same percentage we hold in cash back into our investment portfolio. Assuming we can borrow at the same interest rate we save at. The above equation can be adjusted to:
E[Rw] = c x E[Rc] + (1 – c) x E[Rp] + c x (E[Rp] – E[Rc])
If we simplify that equation and combine terms, we get:
E[Rw] = c x E[Rc] + (1 – c) x E[Rp] + c x E[Rp] – c x E[Rc]
E[Rw] = E[Rp]
To put this into words, if we have a 10% allocation of our total wealth in cash, we can utilize return stacking to scale our investment portfolio up by 10%, and essentially eliminate the cash drag on our wealth.
To make this even better, the investor can still hold that 10% in cash at the bank to fund their spending since the leverage is achieved through the funds that an investor can use.
There are two important things to note here. First, we’re assuming that the return an investor is achieving on their cash savings is the same as the return an investor is implicitly paying for leverage in the return stacking process. Historically, if the investor kept their money in short-term US Treasury bills, this was a reasonable assumption. If, however, an investor keeps their cash in a checking account with no rate of return, then they will be paying an implicit borrowing cost for keeping that cash around that ultimately ends up being no different than the cash drag that would’ve existed in the first place.
Assuming they are able to earn a reasonable savings rate on their cash, this means that they really only pay an implicit borrowing cost when they use the cash. The added flexibility here is that investors can choose when and how to repay that borrow. For example, instead of having to sell securities to come up with cash during significant market drawdowns, investors can effectively borrow cash via return stacking and then unwind the exposure over time, reverse dollar-cost averaging their position.
How Do We Implement It?
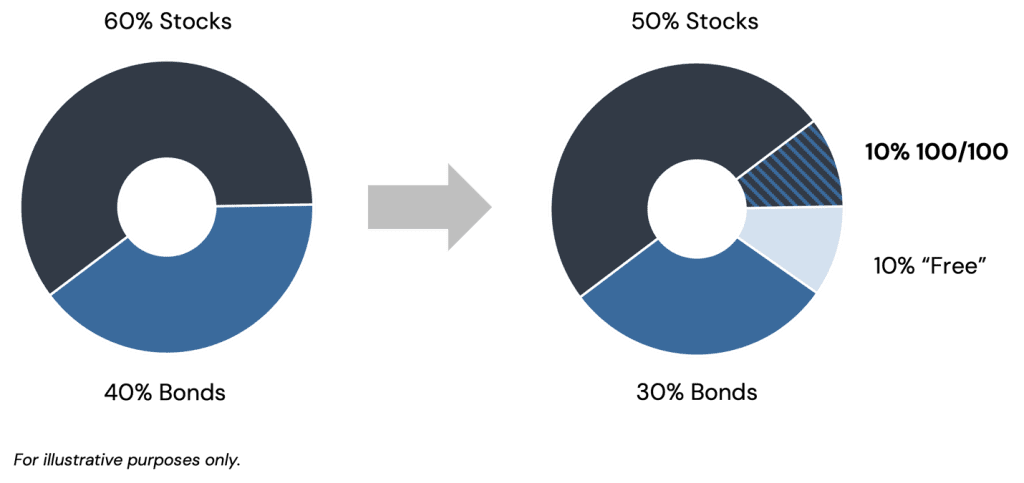
As a simple example, assume there is a fund that for every $1 invested provides $1 of equity exposure and $1 of bond exposure. A 60/40 investor could sell 10% of their stocks and 10% of their bonds and buy a 10% allocation in this fund, freeing up 10% of their capital to hold in cash.
Figure 1: Example of a 100/100 Portfolio Used to Free Up Cash

Source: Newfound Research. For illustrative purposes only.
The capital-efficient exposure provided by the fund gives back the stock and bond exposure sold, minus the cost of financing the embedded leverage. If the cash is invested such that it earns an equivalent rate, then the portfolio will have, largely, the same return profile.
The benefit, however, is that the cash is freed up and available for use, if and when an investor needs it.
How Would This Have Helped?
To show how this would have worked in practice, we will backtest a scenario where an investor will hold 10% of their total wealth in cash, re-striking this value once per year, and holds a reasonably diversified portfolio of 54% stocks, 36% bonds, and 10% managed futures, rebalanced quarterly. This makes the investor’s total wealth asset allocation: 10% cash, 48.6% stocks, 32.4% bonds, and 9% managed futures. In this article, we will assume that the cash reserve is not being drawn down during the analysis period.
Importantly, the exact specification of the investment portfolio will not meaningfully change the results. In our analysis, we wanted to use a portfolio that could currently utilize return stacking, but the equation above holds, regardless of the asset allocation or portfolio utilized, as long as it is implementable.
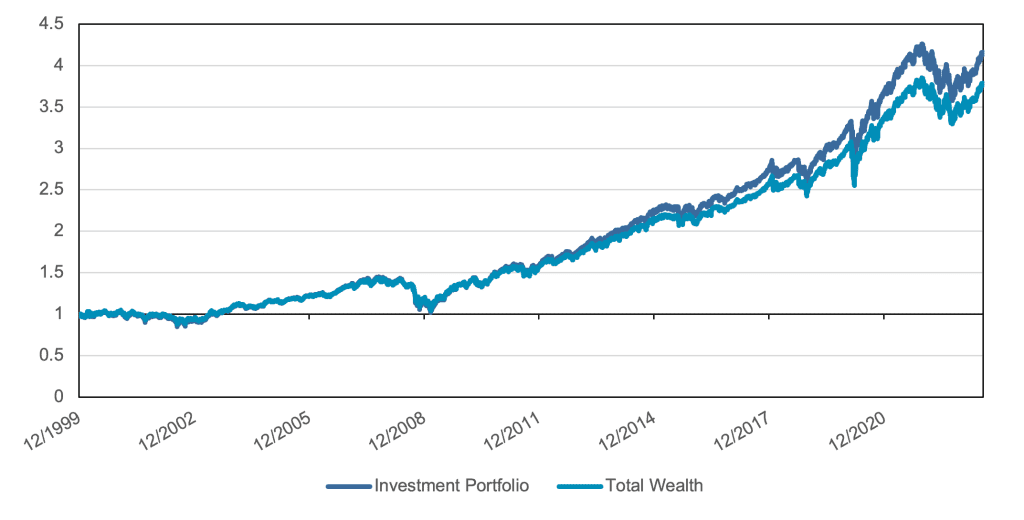
In Figure 2, we show the investor’s portfolio performance, alongside the investor’s total wealth accumulation.
Figure 2: Investment Portfolio and Total Wealth Performance

Source: Tiingo, BarclayHedge. Calculations by Newfound Research. The starting date was chosen due to data availability. Performance is backtested and hypothetical. Performance assumes the reinvestment of all distributions. Performance is gross of all expenses except for underlying expense ratios. Investment Portfolio is a portfolio consisting of 54% in Vanguard 500 Index Fund Investor Shares (ticker: VFINX), 36% in Vanguard Total Bond Market Index Fund Investor Shares (ticker: VBMFX), and 10% in the SocGen CTA Trend Index. Total Wealth is a portfolio of 90% Investment Portfolio, and 10% Cash. Past Performance is not indicative of future results. Performance is calculated from January 2000 to July 2023. You cannot invest directly in an index.
As expected, we see that the total wealth of the investor fell behind that of the investment portfolio due to the 10% cash allocation. Figure 3 shows the realized returns of the investment portfolio and total wealth, as well as the ratio between the two.
Figure 3: Total Returns of the Investment Portfolio and Total Wealth

Source: Tiingo, BarclayHedge. Calculations by Newfound Research. The starting date was chosen due to data availability. Performance is backtested and hypothetical. Performance assumes the reinvestment of all distributions. Performance is gross of all expenses except for underlying expense ratios. Investment Portfolio is a portfolio consisting of 54% in Vanguard 500 Index Fund Investor Shares (ticker: VFINX), 36% in Vanguard Total Bond Market Index Fund Investor Shares (ticker: VBMFX), and 10% in the SocGen CTA Trend Index. Total Wealth is a portfolio of 90% Investment Portfolio, and 10% Cash. Past Performance is not indicative of future results. Performance is calculated from January 2000 to July 2023. You cannot invest directly in an index.
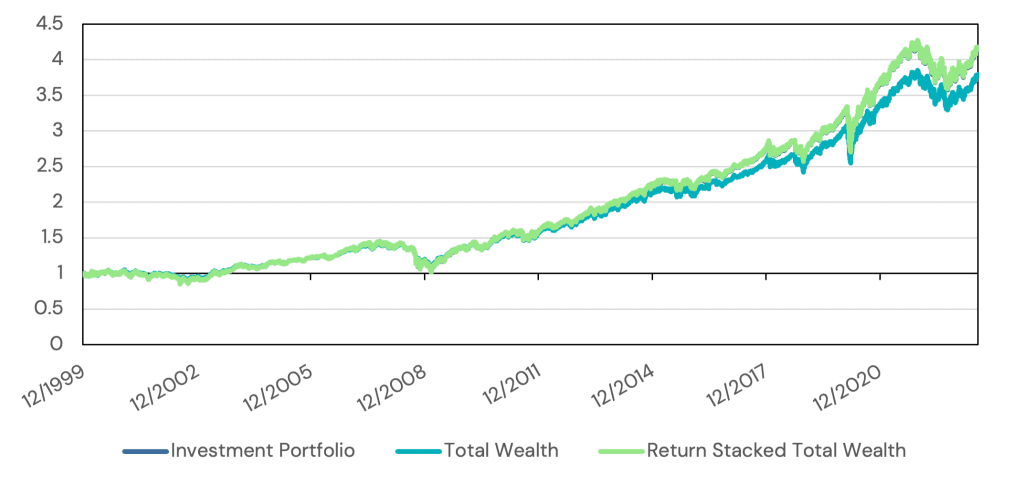
While we already spoiled the conclusion from the equation in the last section, in Figure 4, we show the result of utilizing Return Stacking to right-size our investment portfolio back to our target 54/36/10 relative to our total wealth. This leaves our total wealth asset allocation at 10% cash, 54% stocks, 36% bonds, 10% managed futures, and -10% embedded borrowing in cash.
Figure 4: Return Stacking’s Impact on Total Wealth Accumulation

Source: Tiingo, BarclayHedge. Calculations by Newfound Research. Performance is backtested and hypothetical. Performance assumes the reinvestment of all distributions. Performance is gross of all expenses except for underlying expense ratios. The starting date was chosen due to data availability. Investment Portfolio is a portfolio consisting of 54% in Vanguard 500 Index Fund Investor Shares (ticker: VFINX), 36% in Vanguard Total Bond Market Index Fund Investor Shares (ticker: VBMFX), and 10% in the SocGen CTA Trend Index, rebalanced quarterly. Total Wealth is a portfolio of 90% Investment Portfolio, and 10% Cash. Return Stacked Total Wealth is a portfolio consisting of 10% in Cash, and 90% of a portfolio consisting of 60% in Vanguard Index Fund Investor Shares (ticker: VFINX), 40% in Vanguard Total Bond Market Index Fund Investor Shares (ticker: VBMFX), 10% in the SocGen CTA Trend Index, and a -10% cash allocation, rebalanced quarterly. Past Performance is not indicative of future results. Performance is calculated from January 2000 to July 2023. You cannot invest directly in an index.
Somewhat unsurprisingly, by stacking our investment portfolio to match our target asset allocation, we were able to keep our total wealth growing at the same pace as our investment portfolio, all while leaving our 10% cash sitting safely in the bank. In case it is difficult to see, the Return Stacked Total Wealth (RSTW) line almost perfectly traces the Investment Portfolio line.
In Figure 5, we again show the realized return figures, adding in the RSTW returns to the table. While we can see that RSTW eked out a return slightly above the investment portfolio, this is mostly a relic of our rebalancing decision and would hold a different result if we chose to rebalance at a different periodicity, or on a different day.
Figure 5: Return Stacked Total Wealth

Source: Tiingo, BarclayHedge. Calculations by Newfound Research. Performance is backtested and hypothetical. Performance assumes the reinvestment of all distributions. Performance is gross of all expenses except for underlying expense ratios. The starting date was chosen due to data availability. Investment Portfolio is a portfolio consisting of 54% in Vanguard 500 Index Fund Investor Shares (ticker: VFINX), 36% in Vanguard Total Bond Market Index Fund Investor Shares (ticker: VBMFX), and 10% in the SocGen CTA Trend Index. Total Wealth is a portfolio of 90% Investment Portfolio, and 10% Cash. Return Stacked Total Wealth is a portfolio consisting of 10% in Cash, and 90% of a portfolio consisting of 60% in Vanguard Index Fund Investor Shares (ticker: VFINX), 40% in Vanguard Total Bond Market Index Fund Investor Shares (ticker: VBMFX), 10% in the SocGen CTA Trend Index, and a -10% cash allocation, rebalanced quarterly. Past Performance is not indicative of future results. Past Performance is not indicative of future results. Performance is calculated from January 2000 to July 2023. You cannot invest directly in an index.
The Return Stacking landscape is ever evolving, go deeper by connecting with a team member.
Conclusion
In this article, we sought to tackle the often-encountered problem of cash drag.
For most investors, keeping 100% of our asset invested is practically infeasible. Day-to-day expenses require us to keep cash on hand, and planning for unforeseen expenses can make keeping extra cash around an especially prudent choice. If we sit on too much cash for too long, however, it can materially impact our long-term portfolio returns.
Through return stacking, we no longer must make the decision between keeping cash and investing. We can do both.
Bonus Section: What if our cash reserves don’t earn as much as the borrow rate?
“My cash is in a checking account with no interest, and my savings account, annuities, and CDs don’t pay as much as the borrowing cost. Does this still make sense?” you may ask.
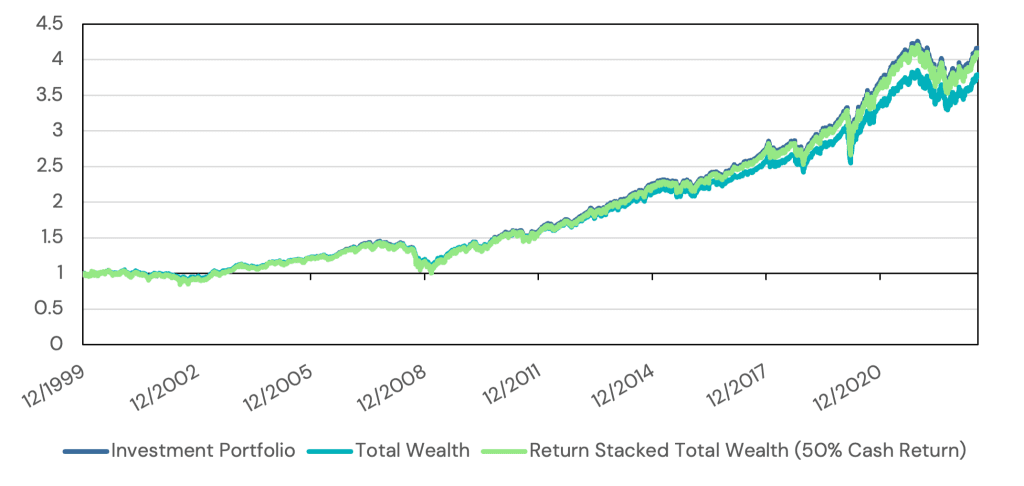
To answer that, we will run the same analysis as before, but now we will assume that our cash return is 50% of the borrow rate. While this does reduce the total wealth return, we still find that we come in above our starting point.
Figure 6: Return Stacking’s Impact on Total Wealth Accumulation with Reduced Cash Return

Source: Tiingo, BarclayHedge. Calculations by Newfound Research. Performance is backtested and hypothetical. Performance assumes the reinvestment of all distributions. Performance is gross of all expenses except for underlying expense ratios.The starting date was chosen due to data availability. Investment Portfolio is a portfolio consisting of 54% in Vanguard 500 Index Fund Investor Shares (ticker: VFINX), 36% in Vanguard Total Bond Market Index Fund Investor Shares (ticker: VBMFX), and 10% in the SocGen CTA Trend Index, rebalanced quarterly. Total Wealth is a portfolio of 90% Investment Portfolio, and 10% Cash. Return Stacked Total Wealth is a portfolio consisting of 10% in Cash, and 90% of a portfolio consisting of 60% in Vanguard Index Fund Investor Shares (ticker: VFINX), 40% in Vanguard Total Bond Market Index Fund Investor Shares (ticker: VBMFX), 10% in the SocGen CTA Trend Index, and a -10% cash allocation, rebalanced quarterly. Past Performance is not indicative of future results. Performance is calculated from January 2000 to July 2023. You cannot invest directly in an index.
APPENDIX A: Index Definitions
Stocks: The Vanguard 500 Index Fund (Investor Shares) (Ticker: VFINX). Performance is gross of all costs (including, but not limited to, advisor fees, taxes, and transaction costs) unless explicitly stated otherwise. Performance assumes the reinvestment of all dividends.
Bonds: The Vanguard Total Bonds Market Index Fund (Investor Shares) (Ticker: VBMFX). Performance is gross of all costs (including, but not limited to, advisor fees, taxes, and transaction costs) unless explicitly stated otherwise. Performance assumes the reinvestment of all dividends.
Managed Futures: The SG Trend Index (Bloomberg ticker: NEIXCTAT) The SG Trend Index is equal-weighted and reconstituted annually. The index calculates the net daily rate of return for a pool of trend following based hedge fund managers.
Risk-Free Rate: Risk-Free rate return data from the Kenneth French Data Library. Performance is gross of all costs (including, but not limited to, advisor fees, manager fees, taxes, and transaction costs) unless explicitly stated otherwise. Performance assumes the reinvestment of all dividends.
