The Glide Path Re-Imagined (Part 2)
Overview
Most asset allocation frameworks through retirement rely primarily on the investors age, while leaving other important variables out of the equation. This piece extends part 1 of this series to include uncorrelated assets into a portfolio and analyze the impact additional diversification can have on retirement success.
Key Topics
Retirement, Glide Path Investing, Asset Allocation, Leverage
Introduction
In Part 1 of our series, we noted that the typical approach to glide path investing primarily focuses on the age of the investor without taking into account other important qualities such as wealth level or life expectancy.
To address these issues, we utilized an approach called “backwards induction” to find stock, bond, and cash portfolios at each wealth level and time step to maximize the probability of success throughout retirement. We defined success in retirement as maintaining enough wealth to support inflation-adjusted withdrawals.
In this post, we will introduce a new investment choice to determine its impact upon optimal portfolio selection and retirement success. As with the last article, we will finish by extending the portfolio selection to allow return stacked®portfolios.
A Brief Refresher
Below we will provide a brief recap on the methodology and terminology used in this series. For a full description of the method, please see Part 1 here.
In crafting a strategy for retirement portfolios, one must concede that no “one-size-fits-all” method exists due to the myriad of individual factors influencing each investor’s needs, such as their financial goals, tax considerations, age, wealth, family obligations, and legacy intentions. We simplify this complex issue by tackling portfolio selection through the lens of two variables: wealth and expected retirement horizon.
Portfolio selection is performed via backwards induction. The methodology unfolds in a reverse chronological order, beginning at the investor’s death with sufficient capital to deem the strategy a success. Then, tracing back one year at a time, we conduct a quarter of a million real return simulations for various asset classes, considering different wealth levels and asset allocations to calculate future wealth after withdrawals. The allocations for the portfolios with the top success rates are averaged, with a perfect success rate (i.e. all candidate portfolio configurations are successful) mandating a transition to a completely cash portfolio (our “least risky” configuration). This iterative process seeks to identify the most successful asset allocations for a given level of real spending and time in retirement, with our stated goal.
The analysis utilizes “real spending units” (RSUs) to represent wealth levels — calculated by dividing the portfolio value by the annual inflation-adjusted spending — providing a tangible measure of the years of spending the portfolio can sustain. Moreover, rather than focusing on age, the concept of “years until death” is used to present data that can be universally applied and tailored to individual circumstances. With these considerations, we analyze a basic allocation among various asset classes to form a foundational understanding of portfolio management leading up to retirement.
Unlevered Stocks, Bonds, Managed Futures, and Cash
To extend the analysis in the previous article, one of the most obvious levers that we may be able to pull is to add another investment choice. For stocks and bonds, a potentially obvious asset to add would be managed futures since this strategy has historically exhibited extremely low correlation to both stocks and bonds.
By increasing the level of portfolio diversification, we can potentially achieve a more stable profile for our portfolio, which most would deem preferable in a retirement portfolio as investment outcomes can be achieved with increased certainty.
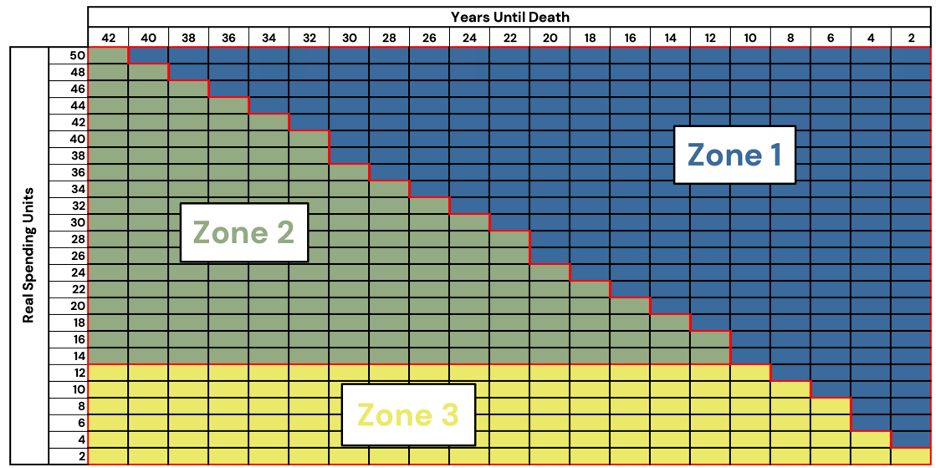
If we remember back to the three zones identified in Part 1 (see Figure 1), Zone 1 is the zone where wealth is sufficient to last through retirement. Despite the inclusion of additional assets, the optimizer still allocates to cash, as there is no benefit of adding any risky assets.
In Zone 2, there is a decent possibility of success, but we could hypothesize that the optimized portfolio in this zone will likely take advantage of the additional diversification to reduce any drawdown impacts, while also potentially boosting the returns, leading to an increase in success rates.
Zone 3, however, is the zone in which the probability of success was so low, that growing the portfolio to sufficiently cover withdrawals is practically infeasible.
As in Part 1, we will focus the analysis in two sections: the first will be unlevered and the second introduces the possibility of leverage into the portfolio.
Stocks, Bonds, Managed Futures, and Cash
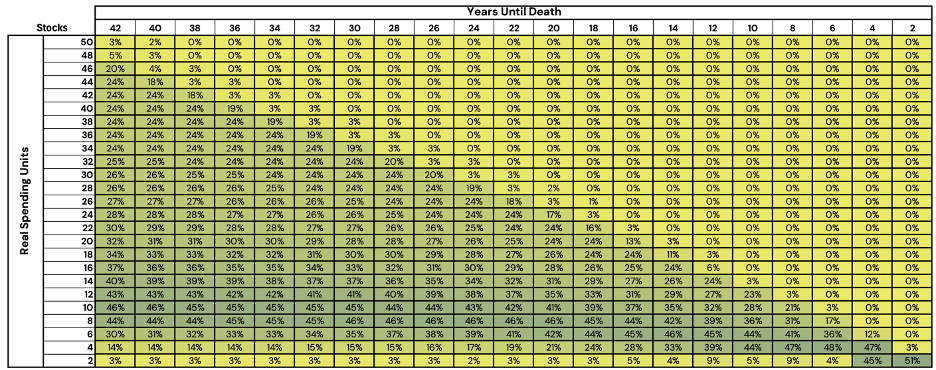
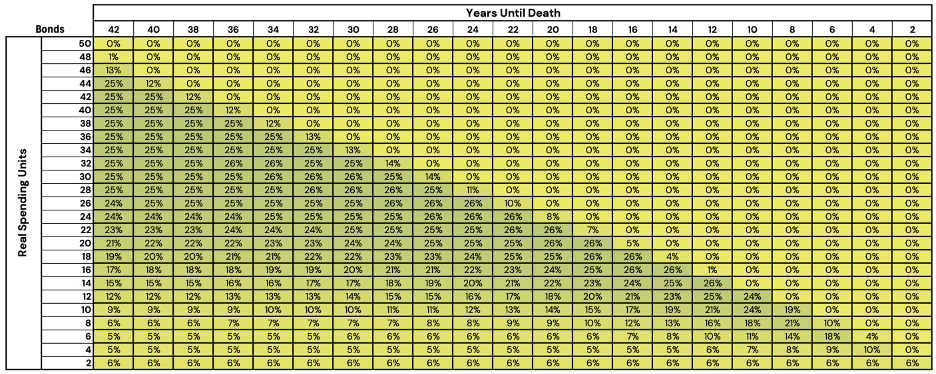
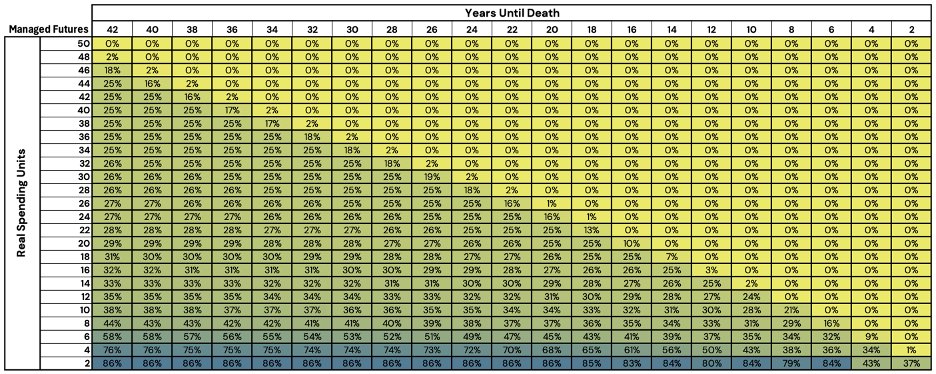
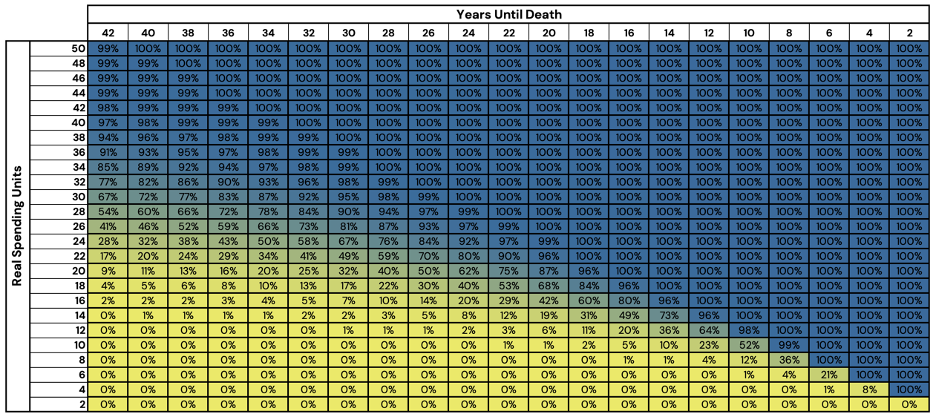
In Figures 2, 3, 4, and 5, we show the optimized allocations for stocks, bonds, managed futures, and cash, respectively, under this framework.
Figure 2: Optimized Stock/Bond/Managed Futures/Cash Glidepath Allocations – Stocks
Source: Newfound Research, Bloomberg. For illustrative purposes, only. This should not be utilized as investment advice. You should consult a financial advisor before engaging in any investment activity. Stocks are represented by the FTSE All World Index (FTAW01 Index), Bonds are represented by the Bloomberg US Agg Total Return Value Unhedged USD Index (LBUSTRUU Index), Managed Futures is represented by the Societe Generale Managed Futures Trend Index (NEIXCTAT Index), and Cash is represented by the Bloomberg Short Treasury Total Return Index Value Unhedged (LD12TRUU Index).
Figure 3: Optimized Stock/Bond/Managed Futures/Cash Glidepath Allocations – Bonds
Source: Newfound Research, Bloomberg. For illustrative purposes, only. This should not be utilized as investment advice. You should consult a financial advisor before engaging in any investment activity. Stocks are represented by the FTSE All World Index (FTAW01 Index), Bonds are represented by the Bloomberg US Agg Total Return Value Unhedged USD Index (LBUSTRUU Index), Managed Futures is represented by the Societe Generale Managed Futures Trend Index (NEIXCTAT Index), and Cash is represented by the Bloomberg Short Treasury Total Return Index Value Unhedged (LD12TRUU Index).
Figure 4: Optimized Stock/Bond/Managed Futures/Cash Glidepath Allocations – Managed Futures
Source: Newfound Research, Bloomberg. For illustrative purposes, only. This should not be utilized as investment advice. You should consult a financial advisor before engaging in any investment activity. Stocks are represented by the FTSE All World Index (FTAW01 Index), Bonds are represented by the Bloomberg US Agg Total Return Value Unhedged USD Index (LBUSTRUU Index), Managed Futures is represented by the Societe Generale Managed Futures Trend Index (NEIXCTAT Index), and Cash is represented by the Bloomberg Short Treasury Total Return Index Value Unhedged (LD12TRUU Index).
Figure 5: Optimized Stock/Bond/Managed Futures/Cash Glidepath Allocations – Cash
Source: Newfound Research, Bloomberg. For illustrative purposes, only. This should not be utilized as investment advice. You should consult a financial advisor before engaging in any investment activity. Stocks are represented by the FTSE All World Index (FTAW01 Index), Bonds are represented by the Bloomberg US Agg Total Return Value Unhedged USD Index (LBUSTRUU Index), Managed Futures is represented by the Societe Generale Managed Futures Trend Index (NEIXCTAT Index), and Cash is represented by the Bloomberg Short Treasury Total Return Index Value Unhedged (LD12TRUU Index).
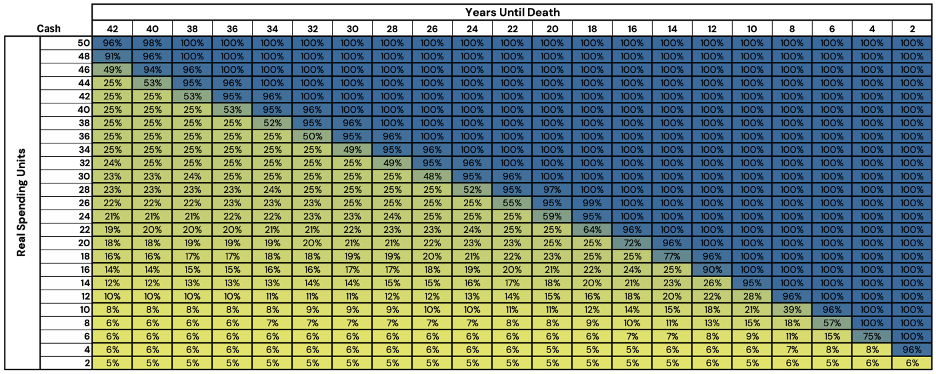
The simulated probability of success at each point of the glidepath can be found in Figure 6.
Figure 6: Probability of Success of Optimized Stock/Bond/Managed Futures/Cash Portfolios
Source: Newfound Research, Bloomberg. For illustrative purposes, only. This should not be utilized as investment advice. You should consult a financial advisor before engaging in any investment activity. Stocks are represented by the FTSE All World Index (FTAW01 Index), Bonds are represented by the Bloomberg US Agg Total Return Value Unhedged USD Index (LBUSTRUU Index), Managed Futures is represented by the Societe Generale Managed Futures Trend Index (NEIXCTAT Index), and Cash is represented by the Bloomberg Short Treasury Total Return Index Value Unhedged (LD12TRUU Index).
For cash, Zone 1, remains largely unchanged from the stock/bond version from Part 1, and the rates of success remain at 100%.
Zone 2, however, is where the results get more interesting. In comparison to our results in Part 1, the portfolios are more diversified, holding positions in stocks, bonds, managed futures, and cash.
The results in Figure 6 plot some of the most interesting results of this analysis. If we recall the zone diagram in Figure 1, there was a distinct right-triangle in the upper right where our probability of success was roughly 100%, simply due to the RSU level being greater than the years left in retirement.
In Figure 6 the lower bound of that triangle has started to bend lower. By incorporating managed futures, an investor with 36 RSUs or above, with 42 years left in retirement, holds a 90%+ probability of success. In Part 1, that same investor had just a 76% success probability.
This is a surprisingly powerful result: By incorporating a diversifying asset like managed futures into a portfolio, an investor can dramatically improve the chances of retirement success.
Zone 3 remains largely unchanged. As we suspected, there is almost nothing an investor can do to overcome that level of wealth deficit. One interesting point to note, however, is that at the 0 RSU level, we see that the optimization favors managed futures over equities.
This result can largely be attributed to the historical skewness in the return profile of these assets. While equities have a high growth potential, they also have historically exhibited devastating drawdowns. When an investor is facing certain failure unless they grow their assets, the optimizer gambled it all on equities in Part 1.
Managed futures, on the other hand, has historically less severe drawdowns than equities while still exhibiting periods of significant positive returns1. This positive skewness was attractive to the optimizer in this extreme case as it represents a more asymmetric lottery ticket.
Register for our Advisor Center
Tools Center:
Easily backtest & explore different return stacking concepts
Model Portfolios:
Return stacked allocations, commentary and guidance designed
for a range of client risk profiles and goals
Future Thinking:
Receive up-to-date insights into the world of return stacking theory and practice
Return Stacking AND Diversification
From the results in Part 1, we saw that incorporating prudent leverage into a simple stock/bond/cash portfolio improved the success rates at all wealth levels and durations of retirement. In this section, we will again allow the optimizer to utilize leverage up to 100% notional to potentially improve the results of the analysis.
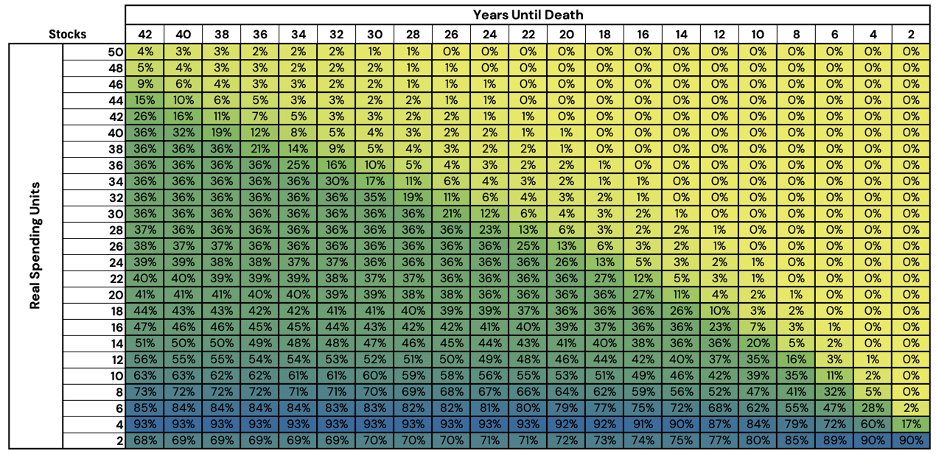
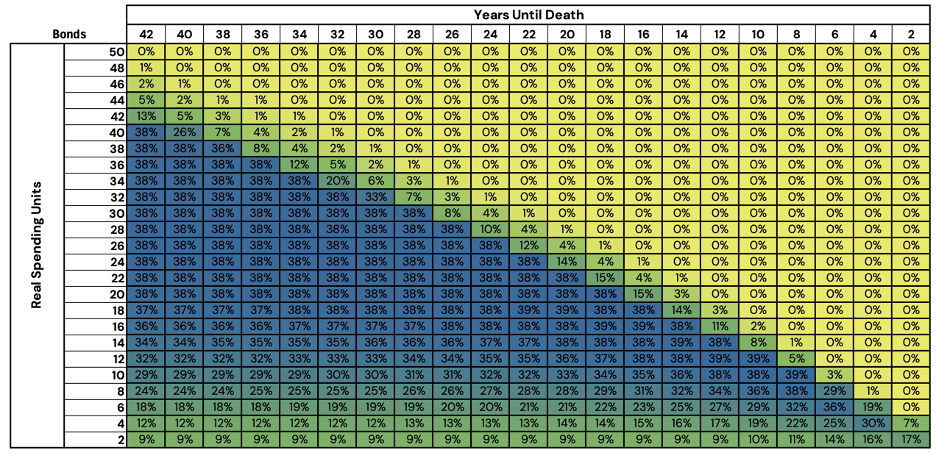
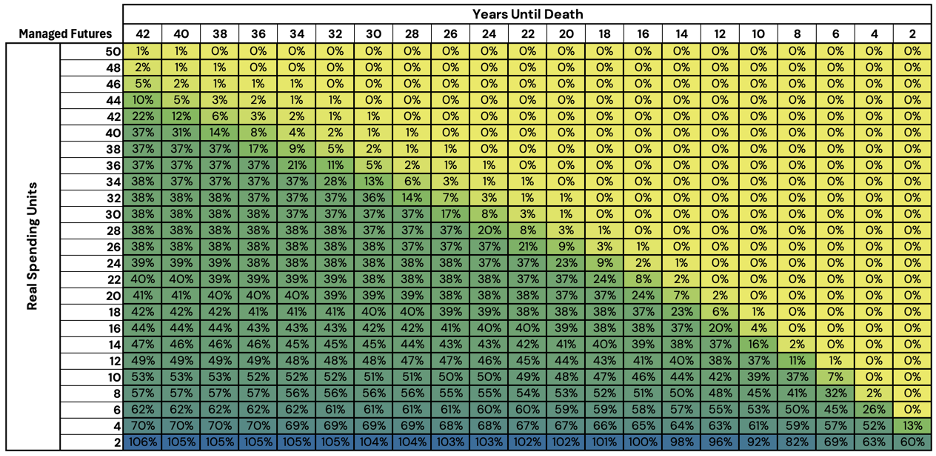
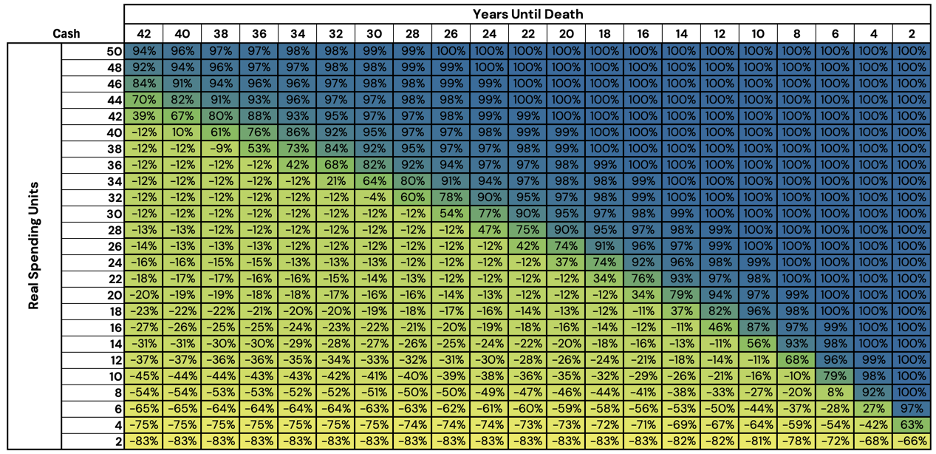
In Figures 7, 8, 9, and 10, we show the optimized allocations when leverage is permitted. As a reminder, when the Cash allocation in Figure 9 has a positive allocation, it indicates that the portfolio is not taking any leverage, while a negative cash allocation suggests that the optimizer is considering leverage to be a prudent choice.
Figure 7: Optimized Stock/Bond/Managed Futures/Cash Glidepath Levered Allocations – Equities
Source: Newfound Research, Bloomberg. For illustrative purposes, only. This should not be utilized as investment advice. You should consult a financial advisor before engaging in any investment activity. Stocks are represented by the FTSE All World Index (FTAW01 Index), Bonds are represented by the Bloomberg US Agg Total Return Value Unhedged USD Index (LBUSTRUU Index), Managed Futures is represented by the Societe Generale Managed Futures Trend Index (NEIXCTAT Index), and Cash is represented by the Bloomberg Short Treasury Total Return Index Value Unhedged (LD12TRUU Index).
Figure 8: Optimized Stock/Bond/Managed Futures/Cash Glidepath Levered Allocations – Bonds
Source: Newfound Research, Bloomberg. For illustrative purposes, only. This should not be utilized as investment advice. You should consult a financial advisor before engaging in any investment activity. Stocks are represented by the FTSE All World Index (FTAW01 Index), Bonds are represented by the Bloomberg US Agg Total Return Value Unhedged USD Index (LBUSTRUU Index), Managed Futures is represented by the Societe Generale Managed Futures Trend Index (NEIXCTAT Index), and Cash is represented by the Bloomberg Short Treasury Total Return Index Value Unhedged (LD12TRUU Index).
Figure 9: Optimized Stock/Bond/Managed Futures/Cash Glidepath Levered Allocations – Managed Futures
Source: Newfound Research, Bloomberg. For illustrative purposes, only. This should not be utilized as investment advice. You should consult a financial advisor before engaging in any investment activity. Stocks are represented by the FTSE All World Index (FTAW01 Index), Bonds are represented by the Bloomberg US Agg Total Return Value Unhedged USD Index (LBUSTRUU Index), Managed Futures is represented by the Societe Generale Managed Futures Trend Index (NEIXCTAT Index), and Cash is represented by the Bloomberg Short Treasury Total Return Index Value Unhedged (LD12TRUU Index).
Figure 10: Optimized Stock/Bond/Managed Futures/Cash Glidepath Levered Allocations – Cash
Source: Newfound Research, Bloomberg. For illustrative purposes, only. This should not be utilized as investment advice. You should consult a financial advisor before engaging in any investment activity. Stocks are represented by the FTSE All World Index (FTAW01 Index), Bonds are represented by the Bloomberg US Agg Total Return Value Unhedged USD Index (LBUSTRUU Index), Managed Futures is represented by the Societe Generale Managed Futures Trend Index (NEIXCTAT Index), and Cash is represented by the Bloomberg Short Treasury Total Return Index Value Unhedged (LD12TRUU Index).
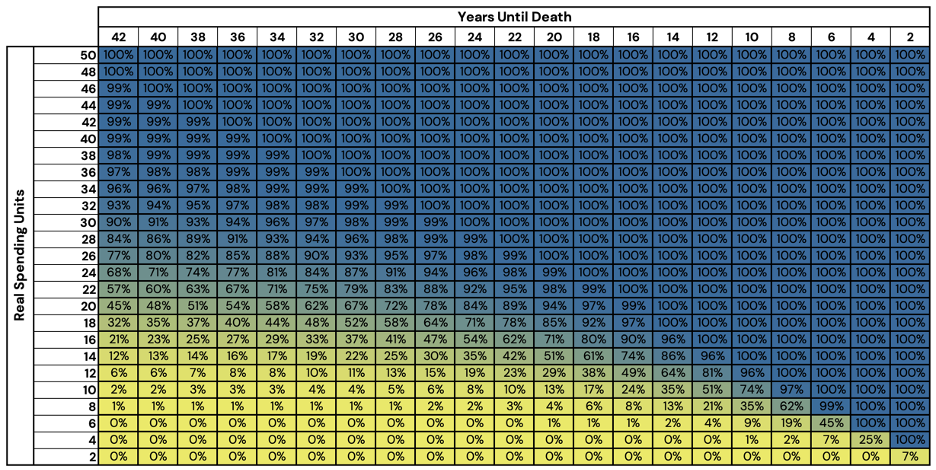
Figure 11 shows the new success rates of these levered, diversified portfolios.
Figure 11: Probability of Success of Optimized Levered Stock/Bond/Managed Futures/Cash Portfolios
Source: Newfound Research, Bloomberg. For illustrative purposes, only. This should not be utilized as investment advice. You should consult a financial advisor before engaging in any investment activity. Stocks are represented by the FTSE All World Index (FTAW01 Index), Bonds are represented by the Bloomberg US Agg Total Return Value Unhedged USD Index (LBUSTRUU Index), Managed Futures is represented by the Societe Generale Managed Futures Trend Index (NEIXCTAT Index), and Cash is represented by the Bloomberg Short Treasury Total Return Index Value Unhedged (LD12TRUU Index).
Broadly, we observe the same themes as before: The optimizer favors high diversification, leverage increases as the shortfall increases, and perhaps most importantly, the probability of success drastically improves.
Interestingly, the amount of leverage recommended by the optimizer is fairly benign for most well-funded retirement plans. “Middle of the road” relative wealth levels use just 10-20% leverage, with more extreme levels being reserved for retirement plans on the precipice of failure.
The Return Stacking landscape is ever evolving, go deeper by connecting with a team member.
Tying It All Together
In this two-part series, we began by questioning the efficacy of an age-based retirement allocation. We found that success in retirement is indeed impacted by the expected duration of retirement, as well as the investor’s wealth level relative to the desired spending amount.
To potentially address this issue, we implemented a backwards induction algorithm that sought to maximize the probability of success for each relative wealth level and retirement tenor. Using a strictly stock, bond, and cash portfolio, we found that the typical age-based allocation rule may not actually be the optimal allocation when accounting for those important retirement variables.
We then sought to see if return stacking could improve these success rates. We found that in the early years of retirement, with a middle-of-the-road level of relative wealth, implementing prudent leverage could nontrivially increase the success of the portfolio.
In Part 2 of the series, we began to analyze the effects that diversification could have on retirement success. Similarly, we started by utilizing an unlevered allocation space, followed by a return stacked® version.
In both cases, we found a material impact on retirement success. By including a diversifying asset in our asset allocation, we find that the increase in diversification has a profound impact on the success rates of the portfolios. Additionally, by allowing the portfolio to utilize prudent leverage, we also find material improvements in success rates, again, in the middle-of-the road level of relative wealth.
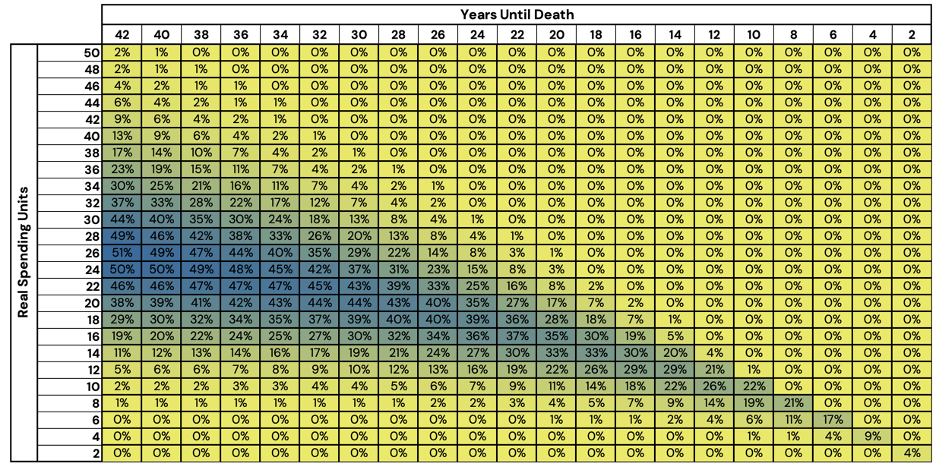
In Figure 12, we show the all-in success rate improvement of a return stacked, diversified portfolio, over the simple unlevered stock/bond/cash portfolios from part 1.
Figure 12: Success Rate Improvement Through Return Stacking and Diversification
Source: Newfound Research, Bloomberg. For illustrative purposes, only. This should not be utilized as investment advice. You should consult a financial advisor before engaging in any investment activity. Stocks are represented by the FTSE All World Index (FTAW01 Index), Bonds are represented by the Bloomberg US Agg Total Return Value Unhedged USD Index (LBUSTRUU Index), Managed Futures is represented by the Societe Generale Managed Futures Trend Index (NEIXCTAT Index), and Cash is represented by the Bloomberg Short Treasury Total Return Index Value Unhedged (LD12TRUU Index).
When transitioning from a constrained space of stocks, bonds, and cash, all unlevered, to a return stacked stock, bond, managed futures, and cash, space, we see an extremely promising result.
If we take a specific example, an investor looking to withdraw $50,000 (real) annually in retirement, that has managed to save up a $1,200,000 retirement portfolio ($1,200,000 / $50,000 = 24 RSUs) and an expected 42 years left in retirement has increased their probability of success by 50%, merely by including diversifying assets, as well as incorporating a prudent amount of leverage into their portfolio (going from an 18% success rate to a 68% rate).
Looking at the surrounding areas of Figure 12, we find lower improvement rates; however, an increase of 30% (43 RSUs with 42 years left in retirement) is still noteworthy. In fact, reviewing the success rates from Figure 11, we find that we have increased the success rates to above 90% with a minimum of 30 RSUs and 42 years left in retirement.
Conclusion
While employing an age-related allocation rule can offer a convenient heuristic, our glidepath series demonstrates that incorporating personalized investor details can lead to a more appropriate asset allocation strategy.
Furthermore, Part 2 of this series examines the impact of diversification and the significance of return stacking on an investor’s retirement prospects. By integrating uncorrelated assets and employing prudent leverage, retirees stand to gain significant benefits from these investment techniques.
In summary, our findings underscore the importance of tailoring investment strategies to individual circumstances and utilizing diversification with prudent leverage to enhance retirement outcomes.
Footnotes
¹ Historically, the Societe Generale Trend Index has seen a maximum daily drawdown of 20.7%, as opposed to the FTSE All World Index with a 54.5% maximum daily drawdown since 1999, in nominal terms. In the bootstrapped simulations, managed futures had a maximum drawdown of around 50% while equities had a maximum drawdown of around 70%.
