Can Randomly Allocated Portfolios Generate Excess Returns?
Overview
For anyone familiar with portfolio theory, it should come as no surprise that adding diversification and leverage can increase the expectation that a portfolio outperforms its benchmark. But how precisely does that portfolio need to be constructed? In this article we explore the surprisingly strong performance of even randomly generated portfolios.
Key Topics
Diversification, Information Ratio, Leverage
One of the most enduring principles of portfolio management is encapsulated by Harry Markowitz’s famous proclamation: “Diversification is the only free lunch in investing.” The concept of diversification is deeply ingrained in the landscape of investing, often visualized through its impact on the efficient frontier.
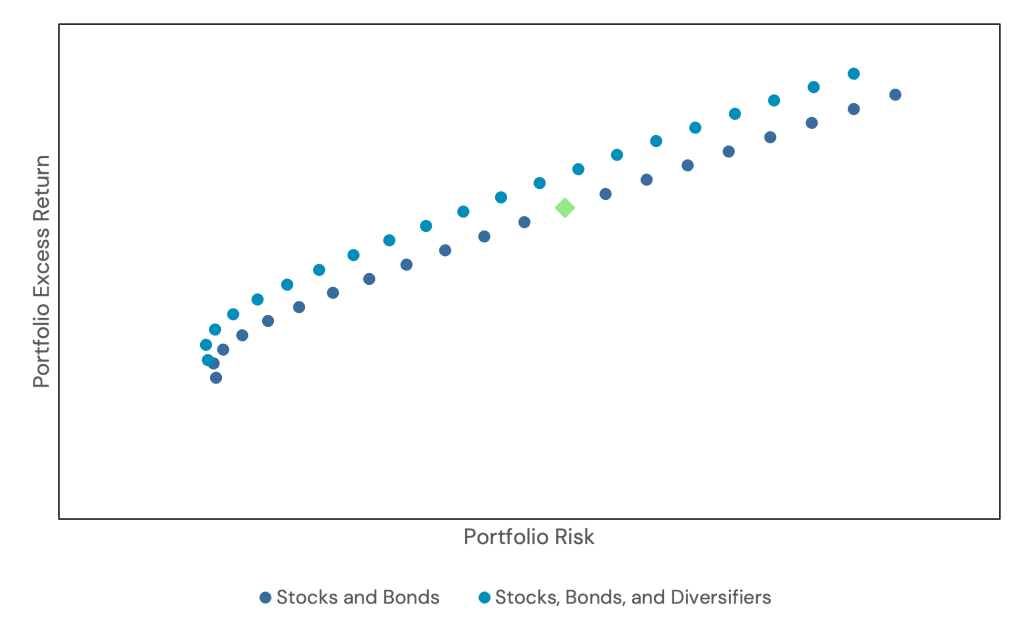
In Figure 1, we present a hypothetical efficient frontier that explores various combinations of stocks and bonds. Additionally, we delve into the potential effects of incorporating an uncorrelated diversifier into the mix. To provide context, we also pinpoint the positioning of a classic 60/40 stock-bond portfolio on this frontier.
Figure 1: Hypothetical Efficient Frontier
Source: Newfound Research. For illustrative purposes only.
While the efficient frontier is a powerful tool for illustrating the impact of asset allocation, what often escapes the visual representation is the real-world experience for an investor navigating these portfolios.
Let’s delve into the intuitive aspects of the efficient frontier. In the context of the Stock and Bond series, adjusting the allocation to equities typically leads to an increase in both expected return and volatility.
However, the introduction of diversifiers introduces a fascinating dynamic, allowing us to shift the frontier up-and-to-the-left. This opens the door to achieving a higher expected return while maintaining an equivalent or even lower level of risk.
Yet, beyond the lines and data points, what remains unexplored is the tangible experience for investors choosing among the myriad of possible diverse portfolios.
Excess Returns and Tracking Error
When evaluating a portfolio’s performance, incorporating measures relative to a benchmark is crucial. One key metric for this assessment is the information ratio. The information ratio compares the excess return of a portfolio (i.e. the difference in returns between a portfolio and its benchmark) with its tracking error (i.e. the volatility of the excess returns).
For assets that behave “normally,” we can establish a confidence interval to gauge how much our portfolio might deviate from the benchmark in any given year. For instance, for a portfolio with an annual tracking error of 3%, we would expect any given 1-year return to be within plus-or-minus 6% of the benchmark’s 1-year return in 95% of periods (assuming, for a moment, that expected excess returns are zero).
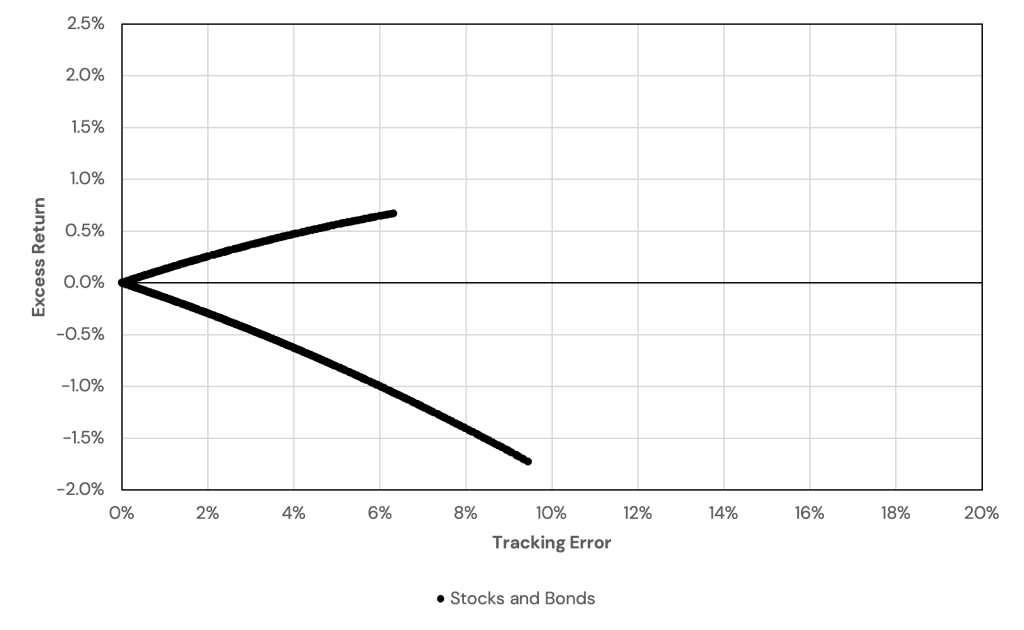
Both excess returns and tracking error offer valuable insights, especially when viewed in relation to a benchmark or reference portfolio. To illustrate this concept, we can plot the realized excess return and tracking error of different stock/bond portfolio allocations versus a traditional 60/40 portfolio using monthly returns starting in 2000.
(A special thanks to Brandon Arns for suggesting this visualization approach.)
Figure 2: Tracking Error of Random Stock/Bond Portfolios
Source: Bloomberg. Calculations by Newfound Research. For illustrative purposes only. Stocks is the FTSE All-World Index (Bloomberg ticker: FTAW01 Index), Bonds is the Bloomberg US Agg Total Return Index (Bloomberg ticker: LBUSTRUU), the 60/40 portfolio is a 60% allocation to Stocks and a 40% allocation to Bonds, rebalanced monthly. Starting date was chosen due to data availability. Past performance is not indicative of future returns.
Knowing that equity markets have outperformed bond markets over the last 20+ years, it makes sense that allocating a higher percentage of our portfolio to stocks has historically increased portfolio returns. A higher percentage allocated to bonds, conversely, would have decreased our excess returns.
However, it’s crucial to note that larger deviations from the target 60/40 portfolio led to an increase in annualized tracking error. For example, a portfolio allocated 100% to bonds realized a tracking error of around 9.5% per year, while a 100% stock portfolio realized a tracking error of around 6.5%.
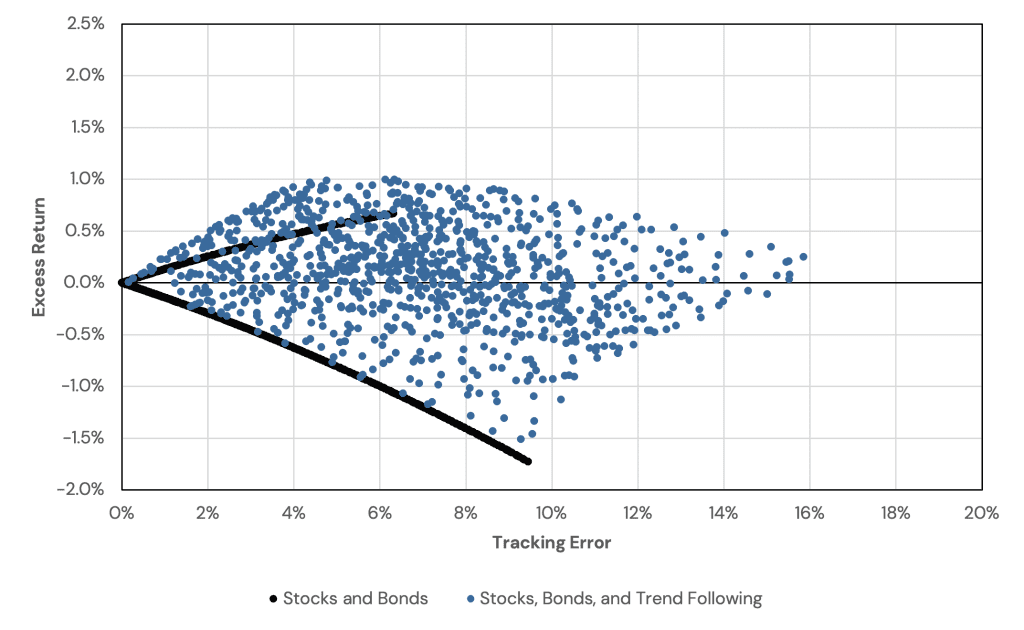
As with the efficient frontier, we can introduce diversifiers and observe how the plot evolves. Specifically, we will incorporate multi-asset trend following, generating results for randomly allocated stock/bond/trend following portfolios.
Figure 3: Tracking Error of Randomly Allocated Stock, Bond, and Trend Following Portfolios
Source: Bloomberg. Calculations by Newfound Research. For illustrative purposes only. Stocks is the FTSE All-World Index (Bloomberg ticker: FTAW01 Index), Bonds is the Bloomberg US Agg Total Return Index (Bloomberg ticker: LBUSTRUU), Trend Following is the SG Trend Index (Bloomberg ticker: NEIXCTAT Index), and the 60/40 portfolio is a 60% allocation to Stocks and a 40% allocation to Bonds, rebalanced monthly. Starting date was chosen due to data availability. Past performance is not indicative of future returns.
As we expand our exploration, a notable revelation emerges within our visual. The addition of a third allocation option creates a dynamic “trapezoid” of possibilities, with the far-right corner representing a 100% allocation to managed futures.
A striking observation is the apparent breach of the “upper bound” of the stock/bond frontier. The introduction of an uncorrelated asset class provided us with the ability to transcend the previously perceived limits. By judiciously incorporating this diversifying asset, we find ourselves in a scenario where we could have achieved an excess return surpassing that of an all-equity portfolio (at least, in hindsight). Remarkably, this accomplishment comes without assuming the same level of equity risk or incurring a comparable tracking error.
Register for our Advisor Center
Tools Center:
Easily backtest & explore different return stacking concepts
Model Portfolios:
Return stacked allocations, commentary and guidance designed
for a range of client risk profiles and goals
Future Thinking:
Receive up-to-date insights into the world of return stacking theory and practice
Return Stacked® Efficient Frontier
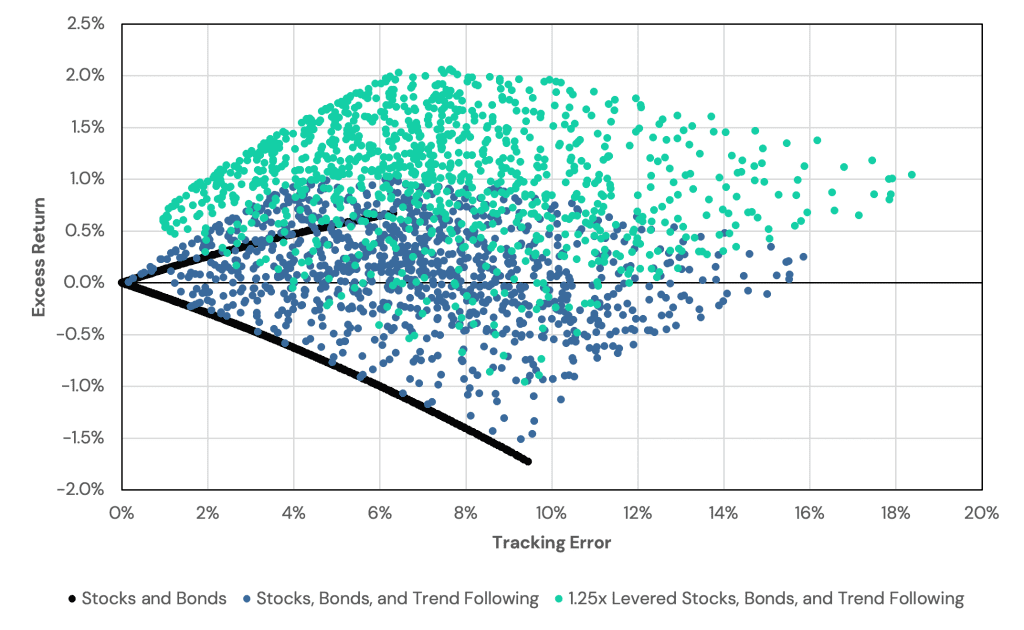
Traditionally, a 100% allocation has marked the upper constraint for portfolios. However, advancements in financial tools now allow us to transcend this limit. Figure 4 illustrates the outcome of randomly generated stock/bond/trend following portfolios but now levered by 25%.
Figure 4: Tracking Error of Randomly Allocated Levered Stock, Bond, and Trend Following Portfolios
Source: Bloomberg. Calculations by Newfound Research. For illustrative purposes only. Stocks is the FTSE All-World Index (Bloomberg ticker: FTAW01 Index), Bonds is the Bloomberg US Agg Total Return Index (Bloomberg ticker: LBUSTRUU), Trend Following is the SG Trend Index (Bloomberg ticker: NEIXCTAT Index), and the 60/40 portfolio is a 60% allocation to Stocks and a 40% allocation to Bonds, rebalanced monthly. Starting date was chosen due to data availability. Past performance is not indicative of future returns.
Returning to the classic efficient frontier, leveraging our portfolio by 1.25x would traditionally result in a proportional increase in both expected return and volatility. A similar observation holds true for the information ratio. Leveraging the 60/40 portfolio by 1.25x results in a commensurate increase in excess return and tracking error. Introducing a third, diversifying exposure, however, allows us to break free of this dynamic.
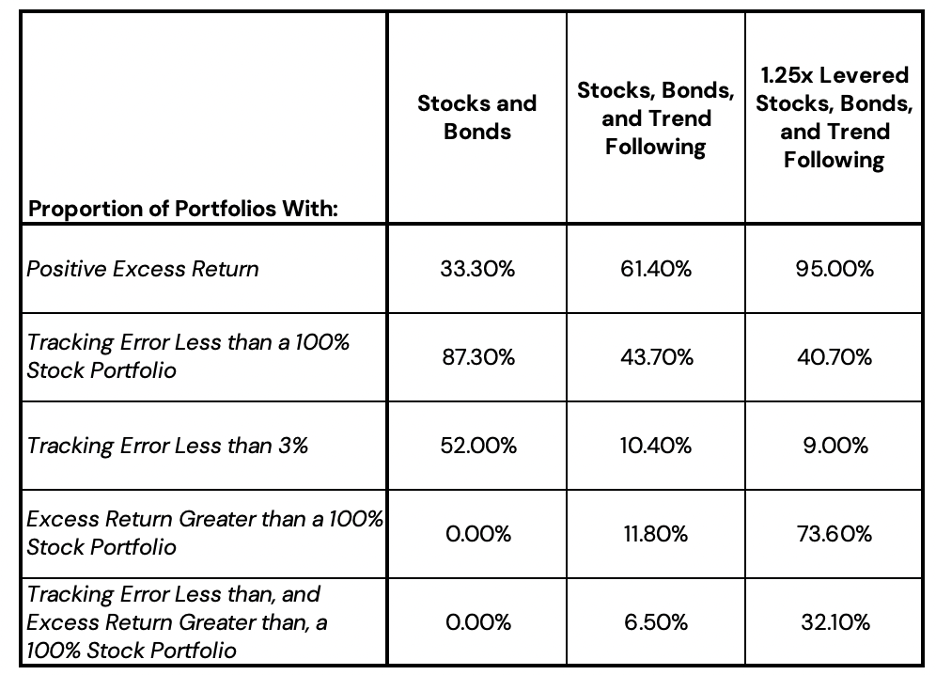
An intriguing insight emerges when we explore the proportion of positive information ratios. While diversification heightened the likelihood of positive outcomes, leveraging the diversified portfolio significantly amplifies this probability.
Figure 5: Information Ratio Metrics for Varying Asset Class Opportunity Sets
Source: Bloomberg. Calculations by Newfound Research. For illustrative purposes only. Stocks is the FTSE All-World Index (Bloomberg ticker: FTAW01 Index), Bonds is the Bloomberg US Agg Total Return Index (Bloomberg ticker: LBUSTRUU), Trend Following is the SG Trend Index (Bloomberg ticker: NEIXCTAT Index), and the 60/40 portfolio is a 60% allocation to Stocks and a 40% allocation to Bonds, rebalanced monthly. Starting date was chosen due to data availability. Past performance is not indicative of future returns.
Notably, across all scenarios, the probabilities of metrics relevant to investors have increased:
Probability of increasing excess returns? Check.
Probability of decreasing tracking error? Check.
Probability of surpassing excess return of an all-stock portfolio? Check.
To put this all another way: if you had randomly allocated across stocks, bonds, and trend following and levered that portfolio 1.25x, there was a 95% chance you created positive excess returns versus a 60/40.
However, a caveat is in order. Tracking errors exceeding 3% are typically a non-starter for most investors. So, let us focus only on those portfolios with tracking errors below 3%. In this subset, the stock/bond portfolio with the highest excess return comprises approximately 86% stocks and 14% bonds. Figure 6 provides a breakdown of portfolio proportions when restricted to less than 3% tracking errors.
Figure 6: Information Ratio Metrics for Varying Asset Class Opportunity Sets Less than 3% Tracking Error
Source: Bloomberg. Calculations by Newfound Research. For illustrative purposes only. Stocks is the FTSE All-World Index (Bloomberg ticker: FTAW01 Index), Bonds is the Bloomberg US Agg Total Return Index (Bloomberg ticker: LBUSTRUU), Trend Following is the SG Trend Index (Bloomberg ticker: NEIXCTAT Index), and the 60/40 portfolio is a 60% allocation to Stocks and a 40% allocation to Bonds, rebalanced monthly. Starting date was chosen due to data availability. Past performance is not indicative of future returns.
For all the time and effort we spend trying to find the optimal combination of assets, this table tells us something quite impressive: historically, you could’ve chosen any 1.25x levered combination of stocks/bonds/trend following that adhered to a 3% tracking error and achieved a positive excess return. And 95.56% of those portfolios outperformed the maximum returning stock/bond mix chosen with hindsight!
Astute investors will note that we’re measuring these results during a period over which stocks, bonds, and trend following all achieved positive returns (and, importantly, positive excess returns). These results are, therefore, arguably tautological. However, we would argue that if you did not have the expectation of these assets having positive realized results going forward, you would not invest in them.
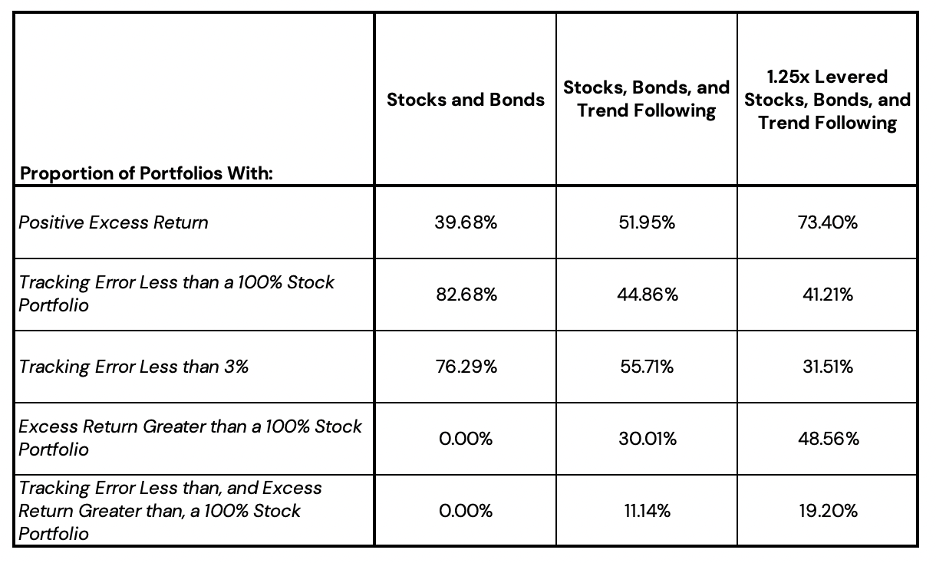
Nevertheless, we can attempt to make our analysis more robust using simulation-based techniques. Using the realized history of these asset classes, we next compile 10,000 simulations by piecing together randomly selected three-month blocks of history into twenty-year periods. Figures 7 and 8, below, show the same proportional information as above, but across the 10,000 simulated histories.
The Return Stacking landscape is ever evolving, go deeper by connecting with a team member.
Figure 7: Information Ratio Metrics for Varying Asset Class Opportunity Sets from Bootstrapped Simulations
Source: Bloomberg. Calculations by Newfound Research. For illustrative purposes only. Stocks is the FTSE All-World Index (Bloomberg ticker: FTAW01 Index), Bonds is the Bloomberg US Agg Total Return Index (Bloomberg ticker: LBUSTRUU), Trend Following is the SG Trend Index (Bloomberg ticker: NEIXCTAT Index), and the 60/40 portfolio is a 60% allocation to Stocks and a 40% allocation to Bonds, rebalanced monthly. Starting date was chosen due to data availability. Past performance is not indicative of future returns.
Figure 8: Information Ratio Metrics for Varying Asset Class Opportunity Sets Less than 3% Tracking Error from Bootstrapped Simulations
Source: Bloomberg. Calculations by Newfound Research. For illustrative purposes only. Stocks is the FTSE All-World Index (Bloomberg ticker: FTAW01 Index), Bonds is the Bloomberg US Agg Total Return Index (Bloomberg ticker: LBUSTRUU), Trend Following is the SG Trend Index (Bloomberg ticker: NEIXCTAT Index), and the 60/40 portfolio is a 60% allocation to Stocks and a 40% allocation to Bonds, rebalanced monthly. Starting date was chosen due to data availability. Past performance is not indicative of future returns.
When we step back and review the outcome of this experiment, the takeaways are quite powerful. When we restrict the asset allocation combinations to those with less than 3% annualized tracking error and incorporating diversifying exposures, our chance of earning a positive excess return increases to 61%, and 93% by incorporating prudent leverage.
Moreover, if our objective is to achieve a return surpassing the highest excess-returning Stock/Bond portfolio, we would need to accurately predict the specific allocation, such as the 86/14 from above. However, by including trend following, we hold a 17% chance of achieving this goal, and a 40% chance by incorporating leverage.
As a result, from a relative perspective, the incorporation of leverage and return stacking reduce the onus of the investor to precisely estimate which stock/bond mix will outperform, or match, the benchmark. By expanding the canvas from which we can construct portfolios, an investor can be less precise, while still increasing the odds of outperformance, while not incurring an unpalatable amount of tracking error.
Conclusion
While the concept of diversification is widely endorsed in the realm of investing, its implementation can prove to be a challenging endeavor.
Adjusting the exposure to stocks and bonds offers the enticing prospect of elevating expected returns. However, the true essence of investing lies in the realized experience. Increasing stock/bond exposure may enhance certain aspects of a portfolio, but the associated tracking error, a vital metric, can pose a considerable challenge for investors.
The incorporation of liquid alternatives not only provides an avenue for potentially augmenting excess returns but without necessarily increasing our tracking error past our tolerance. This dynamic shift introduces a more nuanced approach to portfolio management.
In a culmination of stock, bond, and alternative exposures, we find an intriguing prospect: the potential for heightened excess returns without the customary tradeoff of increasing tracking error. This strategic alignment opens new avenues for investors, offering a unique balance between return optimization and risk mitigation.
