Return Stacking: A Different Way to Outperform our Benchmarks
Overview
The primary indicator of success in the investment industry is the outperformance of a benchmark. Historically, this has been done through security selection but in this article, we provide an alternative method: return stacking.
(This article is written by Rodrigo Gordillo)
Key Topics
Capital Efficiency, Diversified Alternatives, Diversification
In the investment industry, consistently outperforming benchmarks remains a primary indicator of “success.” Historically, the bulk of industry efforts have focused on security selection. This article reviews the effectiveness and consistency of using security selection to beat the S&P 500 within the mutual fund industry. We then introduce an alternative approach that aims to outperform the S&P 500 by using “structural alpha” via return stacking, offering an alternative route to investment success.
The Challenge of Beating Benchmarks
Historically, the mutual fund industry has largely relied on security selection to outperform benchmarks. Yet, data from the S&P Dow Jones SPIVA® report reveals a stark reality: 86.6% of large-cap funds have underperformed the S&P 500 over the last five years. Extending this analysis to 3,220 funds over a 21-year period (Feb 14, 2004 to Feb 14, 2024) using the YCharts database, yields even more sobering insights:
- Only 41 of 3,220 outperformed the S&P 500
- Median outperformance was a mere 0.3% annualized
- The best performer outpaced the S&P by 1.8%
What about consistency? Disappointingly, we find that out of 21 calendar year observations:
- Funds typically underperform in 11 of 21 years
- The top performing fund only outperformed in 13 of 21 years
- The worst fund only outperformed in 6 of 21 years
If fund outperformance is a coin flip in any year, this suggests that a few good years were responsible for the bulk of the outperformance for top funds. The lesson? Timing has mattered – a lot. The typical investor who chases into a fund after a few years of good performance probably missed the boat. This inconsistency highlights a significant challenge for financial advisors and investment officers who are often judged annually on their performance.
Seeking a New Path
What do advisors and Chief Investment Officers (CIOs) really want? Broadly speaking to:
- outperform the benchmark by a small amount
- do so most years, and
- maintain a risk profile consistent with the benchmark
Achieving these goals simultaneously has proven to be exceptionally difficult, if not impossible, via stock-picking. This brings us to an interesting question: Is there a better way?
Stacking Edges
Inspired by Paul Samuelson’s dictum that markets are “micro efficient and macro inefficient,” return stacking is a compelling way to exploit well-known macro inefficiencies available to investors today. This strategy works by stacking alternative betas which, in combination, have historically provided positive excess returns most years. Even better, returns to these strategies tend to exhibit low correlation to stocks, bonds, and each other.
Register for our Advisor Center
Tools Center:
Easily backtest & explore different return stacking concepts
Model Portfolios:
Easily backtest & explore different return stacking concepts
Future Thinking:
Receive up-to-date insights into the world of return stacking theory and practice
Case Study: Alternative Beta Stacking
What we need to provide an attractive structural edge is to find alternative betas to stack that:
- Have historically delivered positive excess returns most years
- Are lowly correlated to the S&P 500
- Are lowly correlated to each other
Let’s explore two examples of strategies that have historically exhibited these enviable qualities.
1) Managed Futures Trend Following
Managed futures trend following is an investment approach with decades of history that aims to capitalize on trends in global futures markets by taking both long and short positions in commodities, currencies, interest rates, and equities. Using systematic and quantitative methods to identify trends, they seek to achieve non-correlated returns to traditional assets with consistent performance in most years.
Strategy Characteristics:
Historically, Managed Futures have exhibited:
- Positive long-term returns
- Low correlation to both stocks and bonds
- Positive returns during equity drawdowns
- Positive returns during inflationary periods
2) Futures Yield (Carry) Strategy
Futures yield, or carry, is the return that accrues to an investor if there is no change in price. For example, coupon payments to bonds and dividends on stocks are common examples of “carry”. Currency and commodity markets also produce carry. Currency carry accrues from borrowing in a currency with low interest rates to purchase short-term bills denominated in a currency with higher interest rates. Commodity carry consists of taking long positions in commodities where the roll yield is positive (backwardation) and short positions where the roll yield is negative (contango). Consistent with managed futures trend following, a futures yield strategy seeks to dynamically harness carry returns from a diversified set of global futures markets by trading into long positions in assets with positive carry, and short positions in assets with negative carry. The strategy seeks to maximize total futures yield, while minimizing the overall risk of the portfolio through diversification.
Strategy Characteristics:
Historically, Managed Futures Yield Strategies have exhibited:
- Positive long-term returns
- Low correlation to stocks, bonds AND managed futures trend strategies
- Positive returns or small losses during equity bear markets
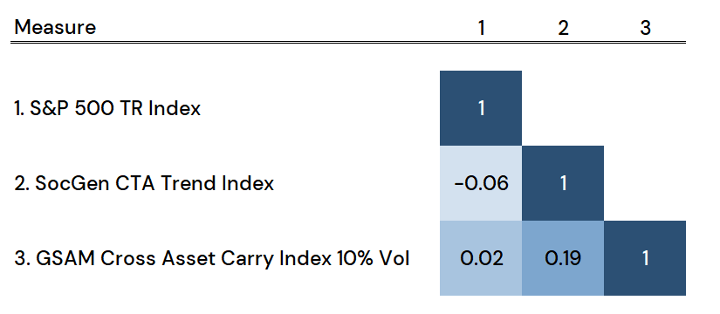
Figure 1. Correlations: S&P 500 TR Index Versus Alternative Betas
Source: Bloomberg. U.S. Stocks is the S&P 500 Index (“SPX”). Returns are gross of all fees. Alternative Beta Stack is the Société Générale Trend Index (“NEIXCTAT”) Bloomberg GSAM Cross Asset Carry Index (Excess Return “BGSXAC”). You cannot invest in an index.
Figure 2. Worst Equity Bear Markets Since the Year 2000
Source: Bloomberg. U.S. Stocks is the S&P 500 Index (“SPX”). Returns are gross of all fees. Alternative Beta Stack is the Société Générale Trend Index (“NEIXCTAT”) Bloomberg GSAM Cross Asset Carry Index (Excess Return “BGSXAC”). You cannot invest in an index. PAST PERFORMANCE IS NOT INDICATIVE OF FUTURE RESULTS.
As we can see from Figures 1 and Figure 2 the characteristics of these strategies seem to complement stocks, bonds, and each other quite impressively.
The quest for consistent benchmark outperformance has long been a challenge for asset owners, who have historically focused on managers seeking to outperform through security selection. Return Stacking offers a promising alternative. By leveraging structural alpha through carefully selected alternative betas, investors can achieve diversification, reduce risk, and enhance returns. This approach represents a significant shift from traditional methods, offering a more reliable and strategic pathway to investment success.
The Return Stacking landscape is ever evolving, go deeper by connecting with a team member.
Case Study Results
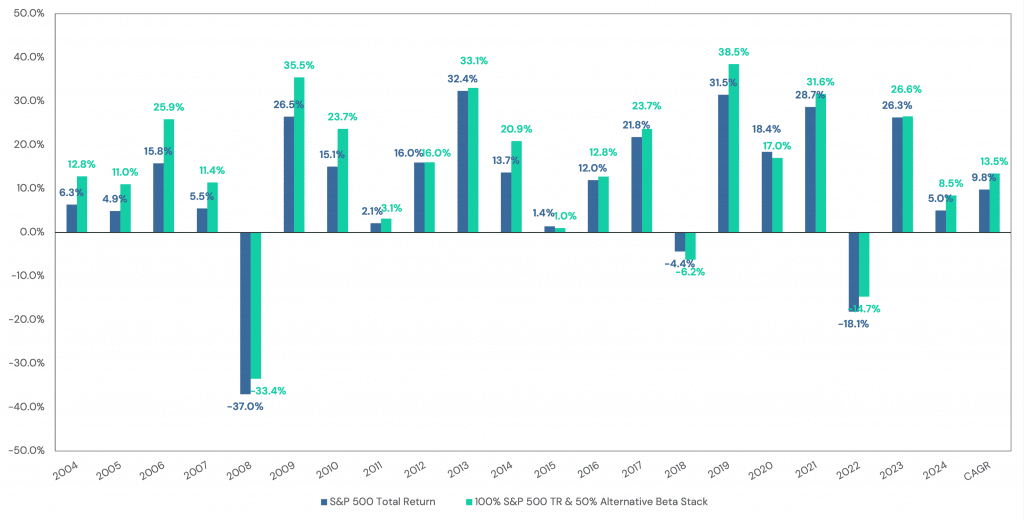
We explore a Return Stacked case study that is comprised of:
- 100% S&P 500 TR index
- 25% SocGen CTA Trend Index (excess Return)
- 25% Bloomberg GSAM Cross Asset Carry Index (Excess Return Scaled to 10% volatility)
Figure 3. Worst Equity Bear Markets From February 14, 2004 to February 14, 2024
Source: Bloomberg. U.S. Stocks is the S&P 500 Index (“SPX”). Returns are gross of all fees. Alternative Beta Stack is 25% of CTA Trend which is the Société Générale Trend Index (“NEIXCTAT”) excess returns less 3 month T-bill using CBOE short-term interest rate index (”IRX”) and 25% of a 10% volatility scaled Bloomberg GSAM Cross Asset Carry Index (Excess Return). You cannot invest in an index.
Conclusion A Paradigm Shift in Investment Strategy
The quest for consistent benchmark outperformance has long been a challenge for asset owners, who have historically focused on managers seeking to outperform through security selection. Return Stacking offers a promising alternative. By leveraging structural alpha through carefully selected alternative betas, investors can achieve diversification, reduce risk, and enhance returns. This approach represents a significant shift from traditional methods, offering a more reliable and strategic pathway to investment success.


