Using a Gold Stack to Hedge U.S. Home Equity Bias
Overview
Many U.S. investors maintain a strong home-country equity bias, often unaware that this also creates an implicit overweight to the U.S. dollar. This currency concentration can become a performance drag when the dollar weakens and international equities rally. Rather than reallocating abroad, this post explores how a capital-efficient gold overlay can hedge that risk while preserving domestic equity exposure. We examine gold’s inverse relationship with the dollar, its positive beta to international equity outperformance, and its historical risk premium. For investors seeking a potentially return-enhancing hedge to USD risk, this approach offers a compelling alternative to traditional diversification.
Key Topics
Home-Country Bias, U.S. Dollar, Gold
Introduction
Many U.S. investors favor domestic equities, whether by fundamental view or just comfort. This home-country bias, however, introduces a hidden risk: an overweight to the U.S. dollar.
This exposure becomes especially relevant during periods when the dollar weakens and international equities outperform their U.S. counterparts. For unhedged U.S. investors, the FX component of foreign returns is a major contributor to relative performance differences. Even when local equity returns are comparable, currency moves can create meaningful return gaps that leave dollar-centric portfolios trailing global benchmarks.
This article is written for U.S. investors – particularly those with a home equity market bias – who are concerned about underperforming international equities but still want to retain their home market tilt. We explore a capital-efficient way to hedge that risk: overlaying gold exposure on top of their domestic equity allocations.
Gold has historically moved inversely to the U.S. dollar and shown a positive correlation to the relative performance of international versus U.S. equities, providing macro-aligned diversification. More importantly, unlike many hedging tools, gold has exhibited a long-term positive risk premium, offering the potential to enhance returns while managing FX-related concentration risk.
Executive Summary
- U.S. investors with a home-country bias are not only overweight domestic equities, but also implicitly overweight the U.S. dollar.
- Currency movements are a major driver of unhedged international equity returns, making dollar strength a key source of relative underperformance.
- Gold tends to rise when the U.S. dollar weakens and has shown a positive beta to the relative performance of international vs. U.S. equities.
- Overlaying gold on top of U.S. equities offers a capital-efficient way to hedge currency risk while preserving domestic equity exposure and adding potential return.
U.S. Home Equity Bias = USD Overexposure
U.S. investors exhibit a significant home-country bias. According to Vanguard, the median U.S. advisor portfolio allocates approximately 75% to domestic equities, compared to just 63% in the MSCI ACWI global equity benchmark: a 12% overweight relative to their benchmark.
Investors who favor U.S. equities, however, not only take on concentration risk in domestic companies, but they’re also implicitly overweight the U.S. dollar versus a basket of international currencies. Consider a U.S. investor wants exposure to the FTSE 100 Index in the UK. To make the investment, the investor must convert U.S. dollars into British Pounds and then purchase UK-listed securities. More broadly speaking, when a U.S. investor buys international equities, they must first sell U.S. dollars to buy foreign currency.
When U.S. investors diversify abroad, therefore, they are not only diversifying their equity exposure: they are also diversifying their currency exposure. A home-country bias implies the opposite: a concentration in U.S. dollar exposure.
This implicit U.S. dollar overweight can become particularly problematic when international equity markets rally on the back of a weaker U.S. dollar. In these periods, international stocks and their currencies tend to rise together, while the dollar (and often U.S. assets) lags.
Register for our Advisor Center
Tools Center:
Easily backtest & explore different return stacking concepts
Model Portfolios:
Return stacked allocations, commentary and guidance designed
for a range of client risk profiles and goals
Future Thinking:
Receive up-to-date insights into the world of return stacking theory and practice
FX as a Driver of International Equity Returns for U.S. Investors
Currency exposure is often the most overlooked driver of return differentials between U.S. and international equity markets. For unhedged U.S. investors, foreign exchange (FX) movements can either amplify or offset local equity returns, dramatically impacting relative performance.
In many developed and emerging markets, local equity returns tend to be positively correlated with their currency’s performance versus the U.S. dollar. When local currencies strengthen, local equities often rally. This dual tailwind – rising equities and rising FX – can significantly boost returns for U.S.-based investors. Conversely, when local currencies weaken, equity markets often struggle at the same time, creating an amplified drag on unhedged foreign investments.
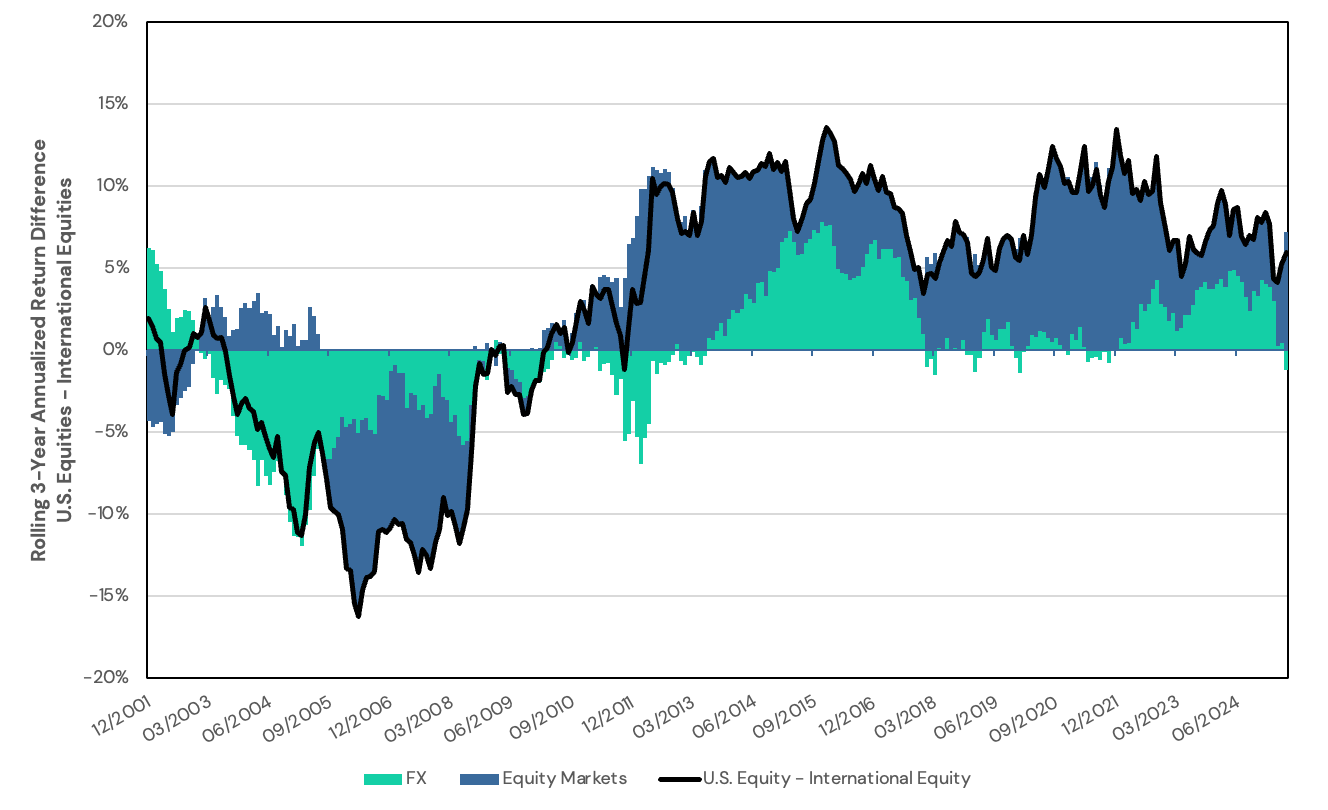
Figure 1 highlights that over rolling 3-year periods, FX effects often dominate the relative return spread between international and U.S. equities for U.S. investors. Even when foreign and domestic equities generate similar local-market returns, currency appreciation or depreciation can shift the outcome materially.
Figure 1. Decomposition of Rolling 3-Year Annualized Returns Between U.S. and International Equities
Source: Bloomberg. Calculations by Newfound Research. International Equities is MSCI ACWI ex USA Net Total Return Index (“NDUEACWZ Index”) net total returns. International Equities (Local) is MSCI ACWI ex USA Net Total Return Local Index (”NDLEACWZ Index”). U.S. Equities is MSCI USA Total Return Index (“M2US Index”). FX is International Equities minus International Equities (Local). Equity Markets is U.S. Equities minus International Equities (Local). Returns are gross of all fees, transaction costs, and taxes. International returns are net of foreign withholding taxes. Returns assume the reinvestment of all distributions. You cannot invest in an index.
For U.S. investors with a persistent home-country bias, this means that USD weakness alone can lead to prolonged periods of underperformance versus global benchmarks. If avoiding foreign equity exposure implicitly embeds a long USD bet, the logical next step is to consider a hedge: one that mitigates this macro risk while fitting within a U.S.-centric portfolio framework.
Gold’s Relationship to the USD
If unhedged international equity returns are significantly driven by currency movements, then addressing U.S. dollar exposure becomes a key consideration for U.S. investors. For those who wish to retain their domestic equity allocation, however, allocating directly to international equities may not be feasible or desirable.
That is where gold comes in.
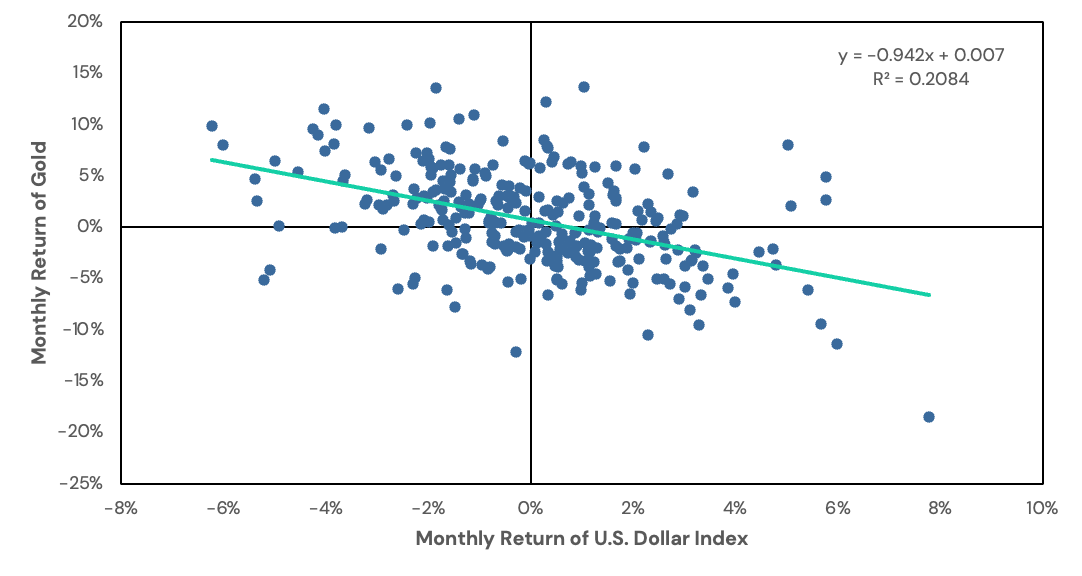
Gold is a non-sovereign asset priced in U.S. dollars. As such, it tends to rise when the dollar weakens and fall when the dollar strengthens. This inverse relationship – typically a correlation of –0.4 to –0.6 – is well-documented and persistent.
Figure 2 shows that gold prices have historically moved opposite the U.S. dollar index (DXY), particularly during sustained periods of global reflation and dollar weakness.
Figure 2. Monthly Returns of Gold versus the US Dollar Index (DXY)
Source: Bloomberg. Calculations by Newfound Research. Gold is front-month gold futures (“GC1 Comdty”). U.S. Dollar Index is the U.S. Dollar Index Spot Rate (”DXY Curncy”). Returns are gross of all fees, transaction costs, and taxes. Returns assume the reinvestment of all distributions. You cannot invest in an index. Past performance is not indicative of future returns.
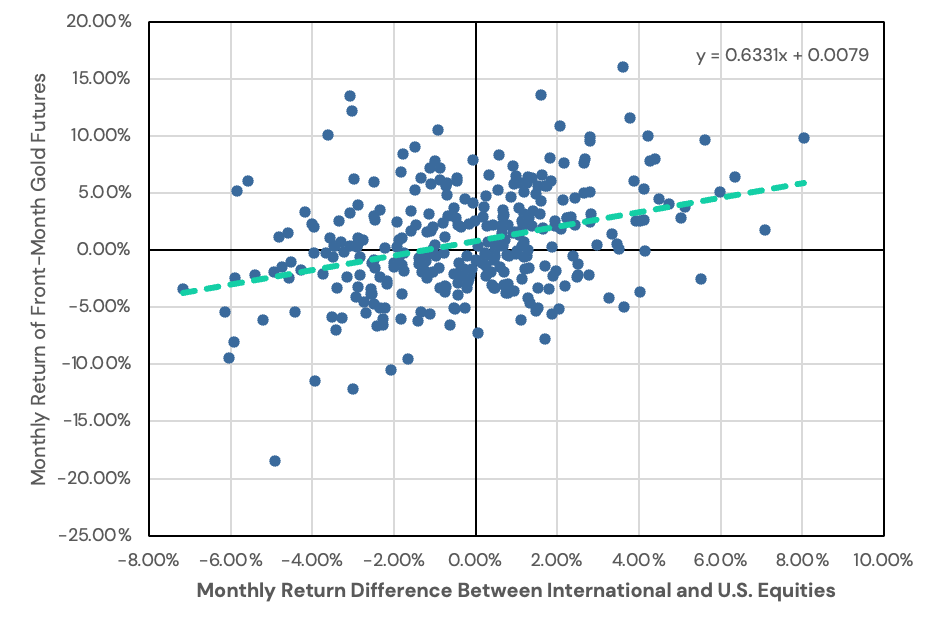
As demonstrated in the previous section, a meaningful proportion of the performance differential between U.S. and international equities is driven by currency movements and gold’s behavior captures this macro dynamic. It should come as no surprise, then, that gold also exhibits a positive beta to the relative returns of international versus U.S. equities. In other words, gold tends to perform well in the same environments that benefit foreign stocks and foreign currencies (see Figure 3).
Taken together, gold may serve as a macro-aligned complement to U.S. equities: one that introduces global currency exposure indirectly and can act as a potential hedge against the relative underperformance versus international equities.
Figure 3. Monthly Returns of Gold versus the Relative Returns of International versus US Equity Returns
Source: Bloomberg. Calculations by Newfound Research. Gold is front-month gold futures (“GC1 Comdty”). International Equities is MSCI ACWI ex USA Index (“NDUEACWZ Index”) net total returns. U.S. Equities is MSCI USA Index (“M2US Index”) total returns. Returns are gross of all fees, transaction costs, and taxes. International returns are net of foreign withholding taxes. Returns assume the reinvestment of all distributions. You cannot invest in an index. Past performance is not indicative of future returns.
The Bonus: Gold’s Historically-Positive Risk Premium
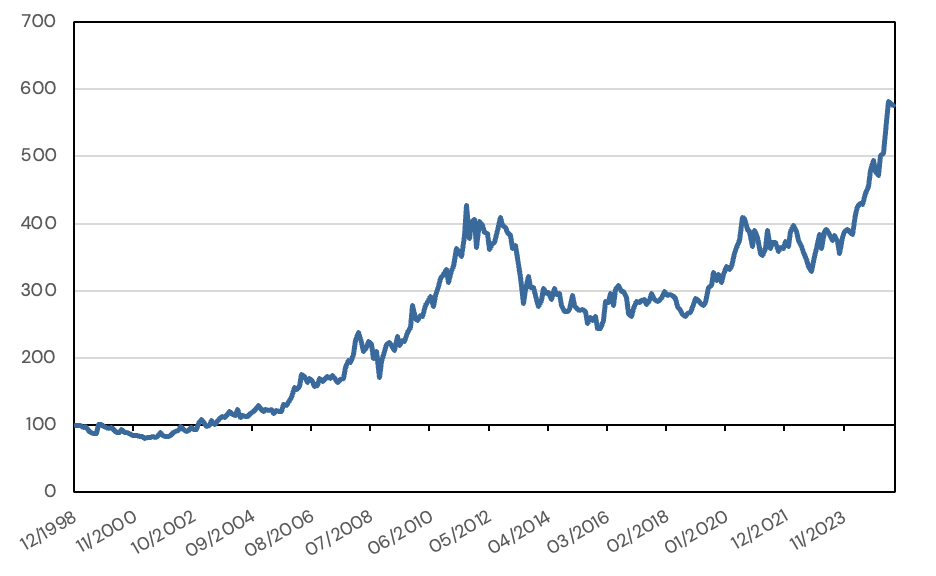
Unlike most hedging tools which often come at a cost to the portfolio, gold has historically realized a positive long-term risk premium. Since the end of the gold standard, gold has delivered ~2–3% excess returns annually, and 8.9% annualized since 2001.
Figure 4. Growth of $100 in Gold Futures
Source: Bloomberg. Calculations by Newfound Research. Gold is front-month gold futures (“GC1 Comdty”). Past performance is no guarantee of futures returns.
Why should gold offer a positive risk premium? In the pre-peg era, gold’s primary role was to preserve purchasing power with virtually no price risk, so it offered little-to-no risk premium. Once the U.S. closed the gold window in August 1971, however, gold investors began to shoulder all of the real‐rate, inflation and policy risks that governments had previously absorbed.
Owning gold no longer guaranteed a stable nominal payoff; instead, it exposed holders to sometimes sharp price swings driven by monetary policy shifts, geopolitical uncertainty, and changes in global liquidity. In effect, gold in the float era became a “non-sovereign currency” that requires investors to be compensated for bearing its unique tail risks and volatility.
Central banks’ ongoing accumulation of reserves further underpins the notion that gold is seen as a strategic macro hedge. With geopolitical tensions and questions about “exorbitant privilege” in the U.S. dollar settlement system, many reserve managers prefer a non-sovereign asset that moves independently of policy-rate spreads or fiscal backstops and has zero counter-party risk. Over the last fifteen years they have added gold to reserves every single quarter, and in 2024 alone they bought an astonishing 1,045 tons: more than double their average annual purchases during 2010–2021.
When sovereigns and central banks step into the market as net buyers of physical gold, they remove metal from the pool of available inventories, increasing the scarcity of deliverable metal and reducing lease supply. Both of these effects increase the “convenience yield” factor of gold pricing.
Regardless of whether gold’s price is supported by a positive risk premium or a positive convenience yield, the empirical evidence suggests that gold futures offer a unique opportunity for U.S. investors: the potential to hedge USD exposure and contribute positively to portfolio returns over time.
U.S. Equity + Gold ≈ International Equity Exposure
Overlaying gold on top of U.S. equities introduces global macro sensitivity without requiring direct ownership of foreign stocks. This pairing can act as a proxy for unhedged international equity exposure, particularly during USD bear markets.
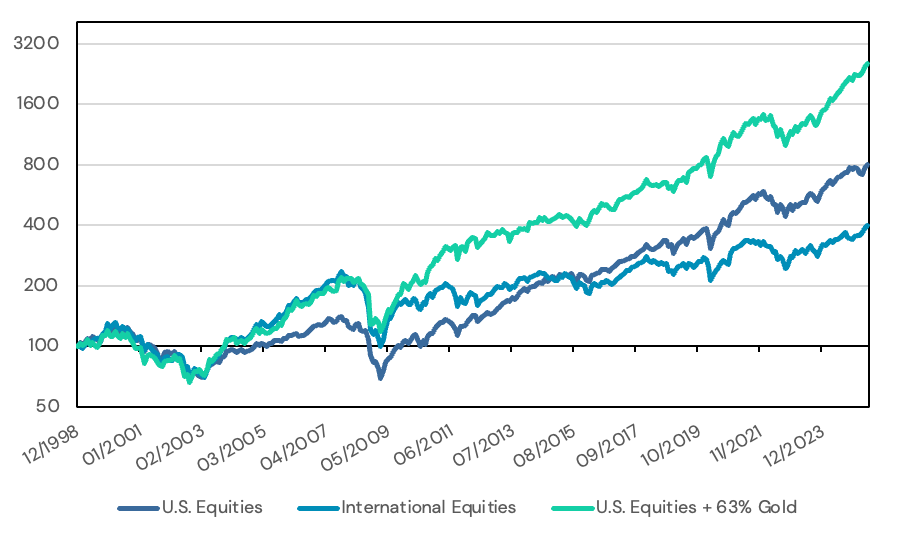
And in Figure 5, we illustrate the impact at the portfolio level: pairing gold with U.S. equities narrows the performance gap between a U.S.-centric portfolio and international equities during periods of USD weakness without requiring direct foreign equity allocations.
Figure 5. Growth of $100 in U.S. Equities, International Equities, and U.S. Equities + 63% Gold Futures
Source: Bloomberg. Calculations by Newfound Research. Gold is front-month gold futures (“GC1 Comdty”). International Equities is MSCI ACWI ex USA Index (“NDUEACWZ Index”) net total returns. U.S. Equities is MSCI USA Index (“M2US Index”) total returns. U.S. Equities + 63% Gold is a 100% U.S. Equities / 63% Gold portfolio rebalanced monthly. Returns are gross of all fees, transaction costs, and taxes. International returns are net of foreign withholding taxes. Returns assume the reinvestment of all distributions. You cannot invest in an index. Past performance is not indicative of future returns.
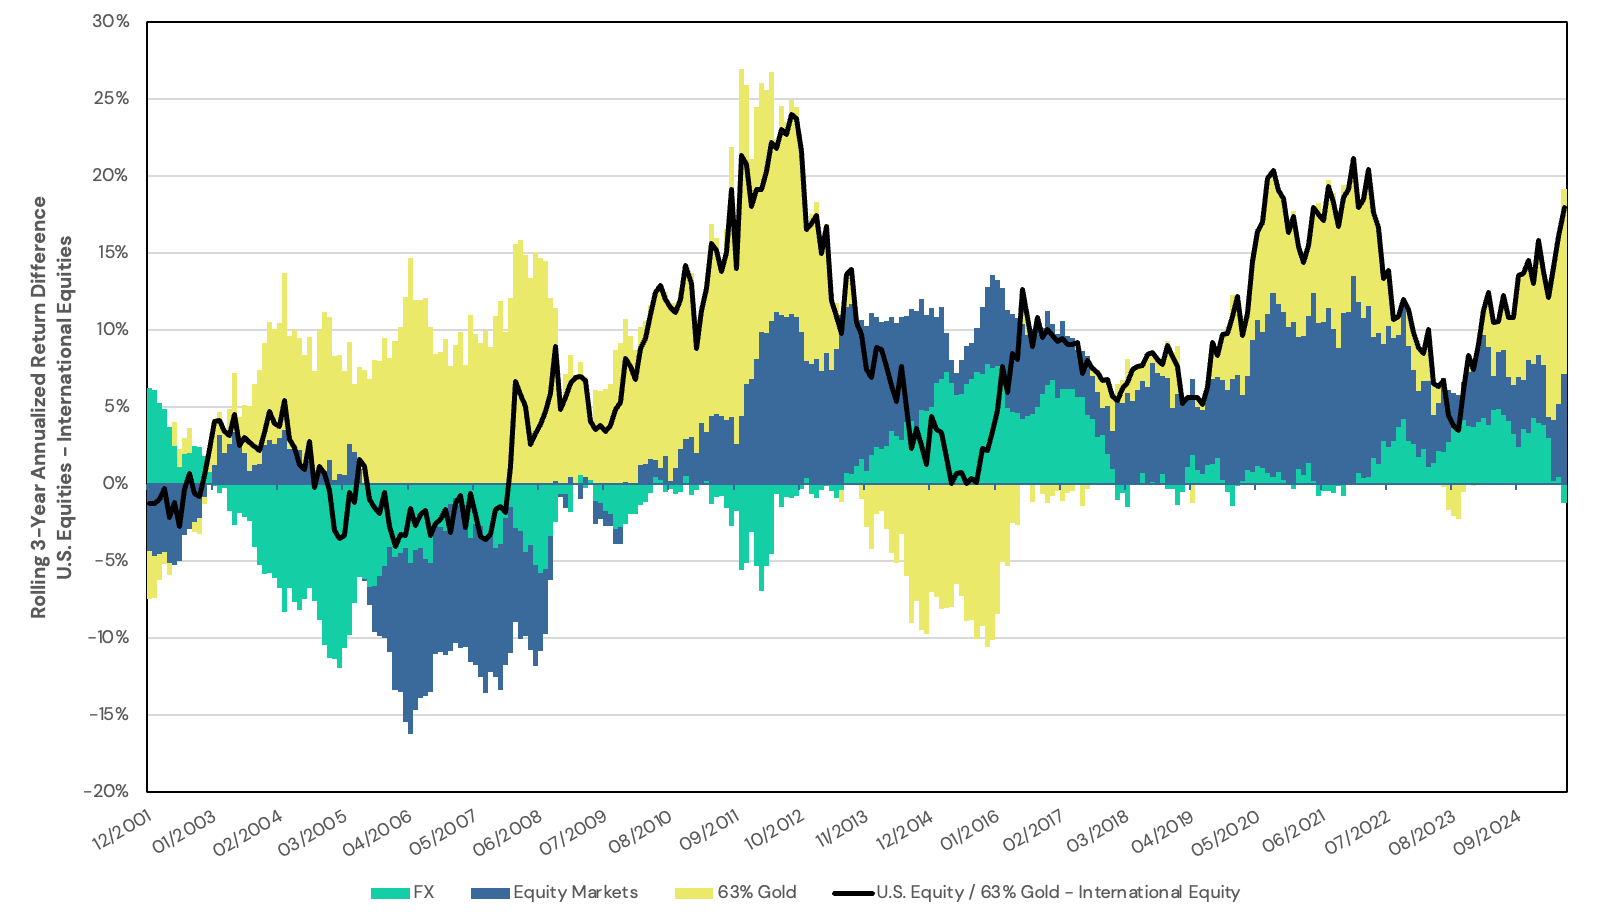
In Figure 6, we decompose the rolling 3-year annualized return difference between international equities and U.S. equities with a 63% gold overlay. We can see that the gold overlay helps reduce the relative underperformance of a U.S. equity portfolio in the early 2000s while retaining its outperformance in the 2010s. The performance in the 2010s is in spite of a bull market in the U.S. dollar that began in 2011; gold’s negative beta to the U.S. dollar was more than offset by gold’s upward drift over the period.
Figure 6. Decomposition of Rolling 3-Year Annualized Returns Between U.S. Equities + 63% Gold Overlay and International Equities
Source: Bloomberg. Calculations by Newfound Research. Gold is front-month gold futures (“GC1 Comdty”). International Equities is MSCI ACWI ex USA Index (“NDUEACWZ Index”) net total returns. U.S. Equities is MSCI USA Index (“M2US Index”) total returns. U.S. Equities + 63% Gold is a 100% U.S. Equities / 63% Gold portfolio rebalanced monthly. Returns are gross of all fees, transaction costs, and taxes. International returns are net of foreign withholding taxes. Returns assume the reinvestment of all distributions. You cannot invest in an index. Past performance is not indicative of future returns.
For investors who are reluctant to allocate directly to international equities, a gold overlay may offer a more palatable alternative. Many investors find it difficult to maintain exposure to foreign markets during periods of U.S. outperformance, often succumbing to performance-chasing behavior and poorly timed reallocations. Gold, by contrast, is commonly perceived as a neutral, strategic asset with a long-term track record and broad intuitive appeal. As such – and especially as an overlay – it may serve as a behaviorally resilient diversifier, helping investors maintain discipline and stick with a global risk-management strategy even when international equities lag.
Ultimately, this approach may appeal to investors who:
- Prefer the governance, fundamentals, liquidity, and familiarity of U.S. companies
- Wish to avoid the complexity and cost of managing foreign equity or FX exposure
- Want to maintain USD-denominated portfolios but reduce implicit currency concentration
Sizing a Gold Overlay
From 12/1998 through 6/2025, Gold’s beta to the relative returns of international vs U.S. equities was 0.63. This suggests that for every $1 that an investor is overweight U.S. equities versus their global benchmark, they could add $0.63 of a gold overlay to hedge the FX risk.
As a specific example, consider an investor that is 100% allocated to U.S. equities versus a global equity benchmark that has just 60% U.S. equity exposure. This implies a 40% overweight to U.S. equities. Using the historical beta calculated above, the 40% overweight could be hedged with a 25% gold overlay (40% x 0.63β = 25%).
Of course, few investors are 100% invested in equities. More generally:
Overlay Size = Portfolio Allocation in Equities x Size of U.S. Overweight x 0.63β
As a more realistic example, let us assume a 60/40 investor. We will also assume that, in line with the Vanguard data quoted above, within their equity exposure they have a 75% allocation to U.S. equities versus a 63% benchmark weight (i.e. a 12 percentage point overweight). To hedge this overweight, we would need, approximately, a 4.5% gold overlay.
60% x 12% x 0.63β = 4.5%
Table 1. Traditional vs Gold hedged Home Biased Global Balanced Portfolios
| Asset Class | Traditional Global Balanced | Home Biased Global Balanced + Gold Hedge |
| U.S. Bonds | 40% | 40% |
| U.S. Equities | 37.8% | 45% |
| Int’l Equities | 22.2% | 15% |
| Gold Futures | 0% | 4.5% |
| Total | 100% | 104.5% |
Conclusion
Gold is not a precise currency hedge, but when paired with U.S. equities it can provide a practical way to replicate the return dynamics of international equity portfolios. For investors with a U.S.-centric allocation, adding gold may offer a smart way to hedge not just against currency debasement, but against the risk of missing out on international equity outperformance tied to a weakening dollar.
This makes gold more than a crisis hedge. It may also be a powerful tool for managing home bias in a globalizing world.

