Re-Thinking the ‘40’ in 60/40: How Return Stacking May Enhance Portfolio Diversification

2025-05-5

Overview

For decades, the 60/40 portfolio – 60% equities and 40% bonds – has served as a foundational asset allocation model for investors. It’s simple, time-tested, and grounded in a core belief: when stocks struggle, bonds typically offer stability.

But markets evolve, and recent years have shown that bonds may not always offer the same protective benefits, especially during inflationary shocks. Advisors seeking to diversify more effectively may want to consider new tools that build on the principles of the 60/40 portfolio – while enhancing the “40” to make it potentially more robust.

Key Topics

Portable Alpha, Excess Returns, Outperformance, Managed Futures

[/ds_layout_sc id="227302"]

When the “40” Falls Short

Historically, bonds have offered a natural counterbalance to equities. During equity market selloffs—such as the tech bubble in the early 2000s or the global financial crisis in 2008—bond prices often rose, helping cushion losses.

However, that pattern does not always hold. In 2022, for example, both asset classes declined sharply. The Bloomberg U.S. Aggregate Bond Index dropped more than 13%, one of its worst years in recent history. The traditional diversifying relationship broke down, largely due to rising inflation and interest rates—a market environment in which both asset classes can struggle.

In other words, the “40” in the 60/40 isn’t always a reliable diversifier, especially when inflation is a dominant concern.

Adding a Different Type of Diversifier

One alternative that has gained institutional traction is managed futures trend following. This strategy seeks to profit from sustained trends across global markets—including equities, bonds, commodities, and currencies—by going long or short depending on the direction of price movements.

Managed futures offer diversification potential due to their flexibility. Unlike bonds, they aren’t structurally tied to any specific macroeconomic indicator. Instead, they adapt to changing market trends. In inflationary environments, managed futures strategies may short bonds or go long commodities—exposures that traditional portfolios may lack.

The Potential of Return Stacking

While many advisors already recognize the diversification potential of managed futures, fitting them into portfolios can be challenging. Allocating 10% to managed futures means taking that 10% from something else—often equities or bonds. That tradeoff can create behavioral friction, especially when managed futures underperform during periods when stocks and bonds are outperforming.

This tradeoff can lead to behavioral challenges. Instead of carving out space, advisors can use funds that combine multiple exposures in a single investment. For example, a fund that delivers 100% bond exposure and 100% managed futures exposure stacks the return streams on top of one another.

Integrating a 100/100 bond/managed futures solution into the “40” sleeve of a 60/40 portfolio may enhance diversification while preserving core bond exposure.

Register for our Advisor Center

Tools Center:
Easily backtest & explore different return stacking concepts

Model Portfolios:
Return stacked allocations, commentary and guidance designed
for a range of client risk profiles and goals

Future Thinking:
Receive up-to-date insights into the world of return stacking theory and practice

A 60/40/20 Portfolio in Action
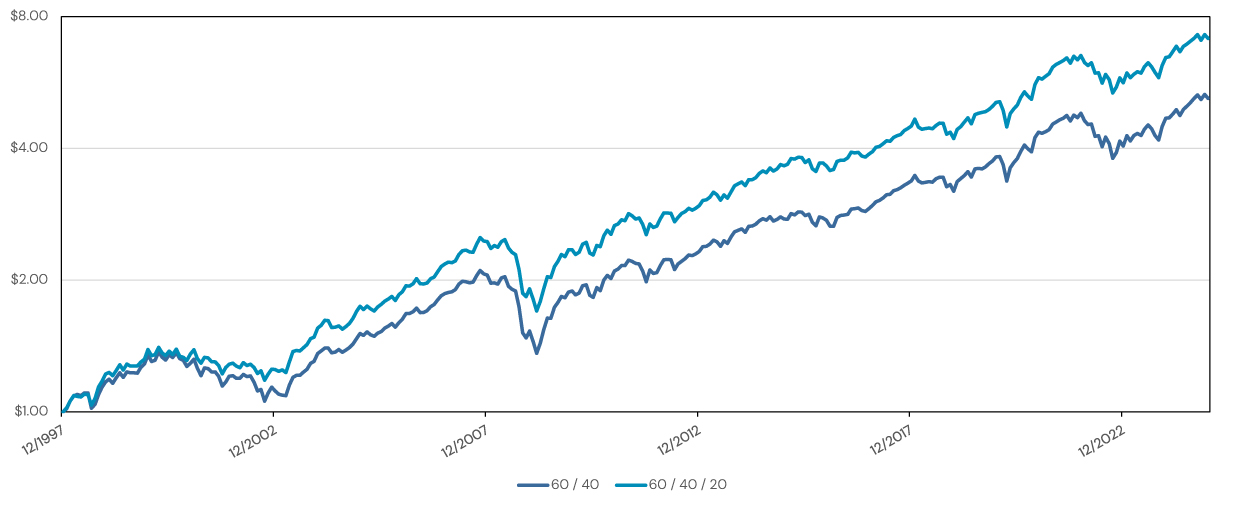
To better understand the impact of stacking managed futures on top of bonds, below, we illustrate the historical performance of a traditional 60/40 portfolio compared to a version in which 20% of bond sleeve is replaced with a 100/100 bonds and managed futures allocation.

The 60/40/20 portfolio has the same total capital allocation (100%) but includes an additional return stream—managed futures—stacked on top of the bond exposure. This approach keeps core bond diversification while layering in trend-following’s adaptive potential.

Figure 1: 60/40 Vs. 60/40/20 Growth of One Dollar

Source: Bloomberg and PivotalPath. Calculations by Newfound Research. 60 / 40 is 60% MSCI All Country World Index (“MXWD”) / 40% Bloomberg US Agg Total Return Value Unhedged Index USD (“LBUSTRUU”) rebalanced monthly. 60 / 40 / 20 is 60% MSCI All Country World Index (“MXWD”), 40% Bloomberg US Agg Total Return Value Unhedged Index (“LBUSTRUU”), 20% PivotalPath Managed Futures (“MFT”), and -20% Bloomberg Short-Term US Treasury Bill Index (“LD12TRUU”) rebalanced monthly. Past performance is not indicative of future results. Performance is gross of all fees, taxes, and transaction costs. Performance assumes the reinvestment of all distributions. Performance of the PivotalPath Managed Futures Index  is net of underlying management and performance fees. Investors cannot invest directly in an index. Performance data is for illustrative purposes only and does not represent actual returns of a specific fund or investment product.

Figure 2: Performance During Equity Drawdowns

Global Equities US Bonds Managed Futures 60 / 40 60 / 40 / 20
2000 – 2002 (Dot-com Crash) -46.2% 28.6% 64.6% -22.8% -15.9%
2008 (Financial Crisis) -48.0% 5.4% 24.9% -30.1% -27.0%
2022 (Rising Rates) -25.4% -14.6% 21.0% -21.1% -17.9%

Source: Bloomberg and PivotalPath. Calculations by Newfound Research. Global equities is the MSCI All Country World Index (“MXWD”). US Bonds is the Bloomberg US Agg Total Return Value Unhedged Index USD. Managed Futures is the PivotalPath Managed Futures Index (“MFT”). 60 / 40 is 60% MSCI All Country World Index (“MXWD”) / 40% Bloomberg US Agg Total Return Value Unhedged Index USD (“LBUSTRUU”) rebalanced monthly. 60 / 40 / 20 is 60% MSCI All Country World Index (“MXWD”), 40% Bloomberg US Agg Total Return Value Unhedged Index (“LBUSTRUU”), 20% PivotalPath Managed Futures (“MFT”), and -20% Bloomberg Short-Term US Treasury Bill Index (“LD12TRUU”) rebalanced monthly. Past performance is not indicative of future results. Performance is gross of all fees, taxes, and transaction costs. Performance assumes the reinvestment of all distributions. Performance of the PivotalPath Managed Futures Index  is net of underlying management and performance fees. Investors cannot invest directly in an index. Performance data is for illustrative purposes only and does not represent actual returns of a specific fund or investment product.
The Inflation Hedge Angle
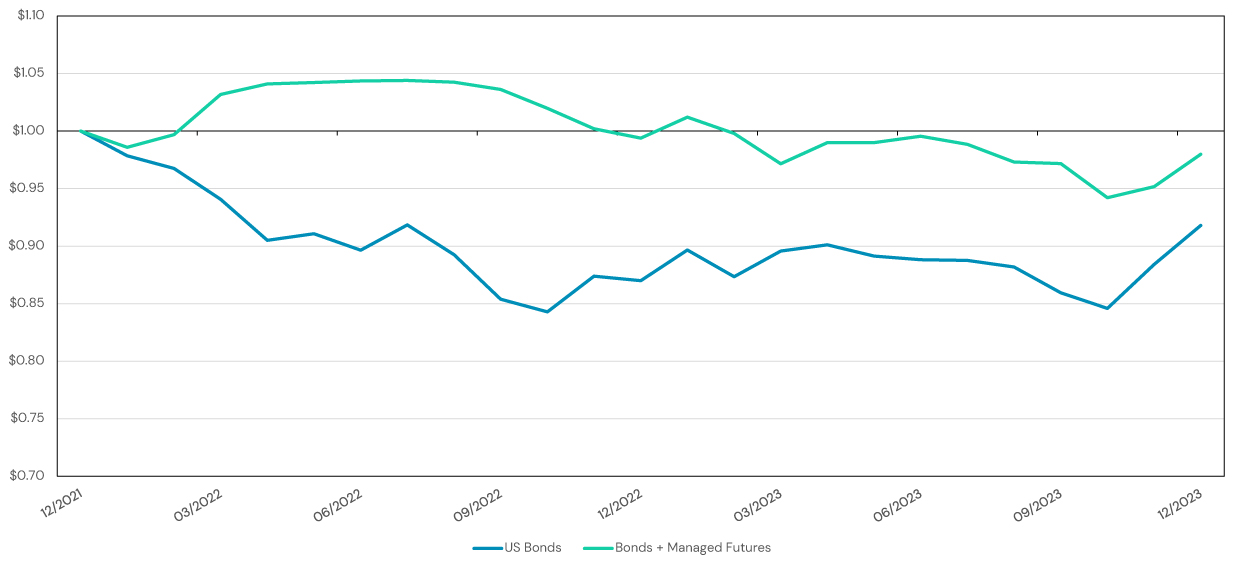
One of the most compelling arguments for adding managed futures to the “40” is their historical performance during inflationary regimes.

Managed futures strategies offer exposure to commodities—an asset class that has traditionally outperformed during inflation shocks. During the 2022 inflation-driven drawdown, many managed futures funds were positioned to benefit from declining bond prices and rising commodity markets, helping offset losses from traditional holdings.

Figure 3: Performance During 2022 – 2023

Source: Bloomberg and PivotalPath. Calculations by Newfound Research. US Bonds is the Bloomberg US Agg Total Return Value Unhedged Index USD (“LBUSTRUU”). Bonds + Managed Futures is 100% Bloomberg US Agg Total Return Value Unhedged Index USD (“LBUSTRUU”) , 100% PivotalPath Managed Futures Index (“MFT”), and -100% allocation to Bloomberg Short-Term US Treasury Bill Index (“LD12TRUU”) rebalanced monthly. Past performance is not indicative of future results. Performance is gross of all fees, taxes, and transaction costs. Performance assumes the reinvestment of all distributions. Performance of the PivotalPath Managed Futures Index  is net of underlying management and performance fees. Investors cannot invest directly in an index. Performance data is for illustrative purposes only and does not represent actual returns of a specific fund or investment product.
By incorporating these strategies without displacing bonds, return stacking may help address one of the core weaknesses of bonds as a portfolio diversifier: inflation sensitivity.

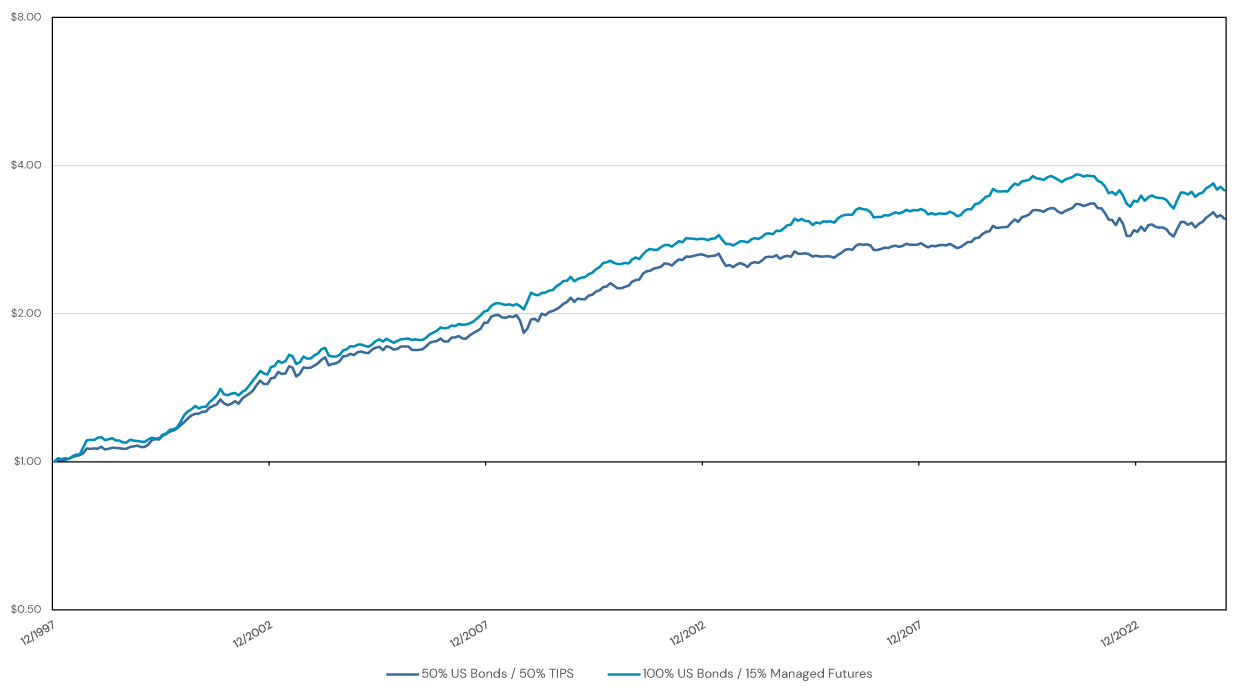
In fact, inflation-protected bonds have historically looked like a stacked 100% Bond + 30% Commodity strategy.  Stacking managed futures may offer a compelling alternative to static commodity exposure, as it has historically provided similar inflation-protection without the same downside exposure to deflationary environments.

Figure 4: Comparison of TIPS and Managed Futures in a Bond-Centric Portfolio

Source: Bloomberg and PivotalPath. Calculations by Newfound Research. 50% US Bonds / 50% TIPS is 50% Bloomberg US Agg Total Return Value Unhedged Index USD (“LBUSTRUU”), and 50% Bloomberg US Treasury Inflation Notes TR Index Value Unhedged USD (“LBUTTRUU”) rebalanced monthly. 100% US Bonds / 15% Managed Futures is 100% Bloomberg US Agg Total Return Value Unhedged Index USD (“LBUSTRUU”) , 15% PivotalPath Managed Futures Index (“MFT”), and -15% allocation to Bloomberg Short-Term US Treasury Bill Index (“LD12TRUU”) rebalanced monthly. Past performance is not indicative of future results. Performance is gross of all fees, taxes, and transaction costs. Performance assumes the reinvestment of all distributions. Performance of the PivotalPath Managed Futures Index  is net of underlying management and performance fees. Investors cannot invest directly in an index. Performance data is for illustrative purposes only and does not represent actual returns of a specific fund or investment product.
Conclusion: Evolving the 60/40, Not Replacing It
The 60/40 portfolio isn’t necessarily broken—but it can be enhanced. By taking advantage of capital-efficient techniques like return stacking, advisors can stack new return sources into the same allocation framework, potentially improving diversification, reducing inflation risk, and smoothing portfolio outcomes.

Return stacking seeks to create more resilient portfolios by addressing a broader range of risks and return drivers, without requiring advisors or clients to give up familiar exposures.

Key Takeaways for Financial Advisors

  • The 60/40 portfolio is a strong foundation, but bonds may not always serve as reliable diversifiers—especially during inflationary shocks.
  • Managed futures trend following strategies can adapt to changing market trends and have historically provided diversification during periods when traditional asset classes faced challenges.
  • Stacking managed futures on top of existing bonds allows advisors to potentially enhance the “40” allocation without giving up core bond exposure.
  • In stress periods, a stacked 60/40/20 portfolio has historically experienced smaller drawdowns than a traditional 60/40.
  • For advisors seeking smarter diversification, return stacking offers a capital-efficient, behaviorally friendly approach to improving client outcomes.